Indian J Med Microbiol Close
 

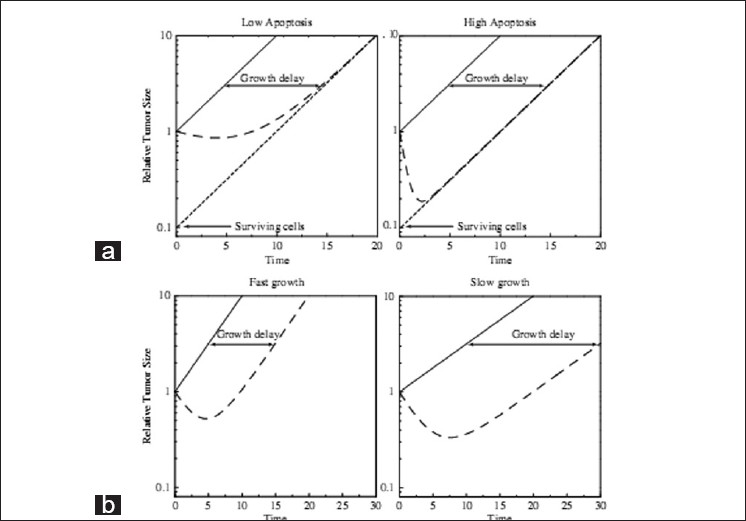
Figure 2: Interpretation of tumor responses in vivo. These illustrations highlight two distinct ways that apoptosis can result in misinterpretation of in vivo treatment responses. (a) Plotted are the hypothetical responses of two tumors with the same growth rates and same overall response to treatment. (b) Plotted are the hypothetical responses of two tumors that again have identical overall treatment sensitivity (the same survival) but very different rates of growth.

Figure 2: Interpretation of tumor responses <i>in vivo</i>. These illustrations highlight two distinct ways that apoptosis can result in misinterpretation of <i>in vivo</i> treatment responses. (a) Plotted are the hypothetical responses of two tumors with the same growth rates and same overall response to treatment. (b) Plotted are the hypothetical responses of two tumors that again have identical overall treatment sensitivity (the same survival) but very different rates of growth.