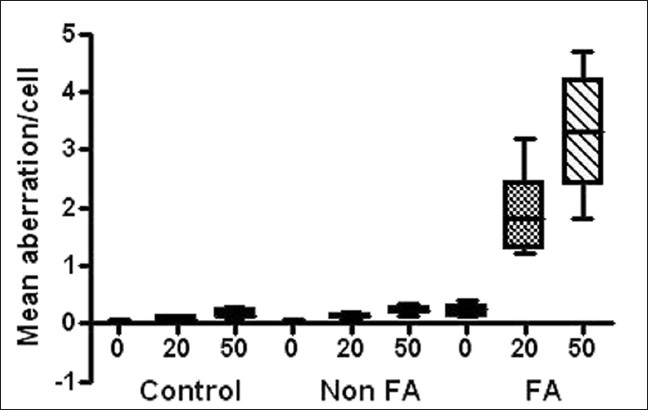
Figure 2: Bar chart showing mean aberration per cell observed in the different study groups after treatment with various concentrations of mitomycin C (MMC). MMC treatment at both concentrations used could effectively differentiate between Fanconi anemia (FA), non-FA patients and controls