Close
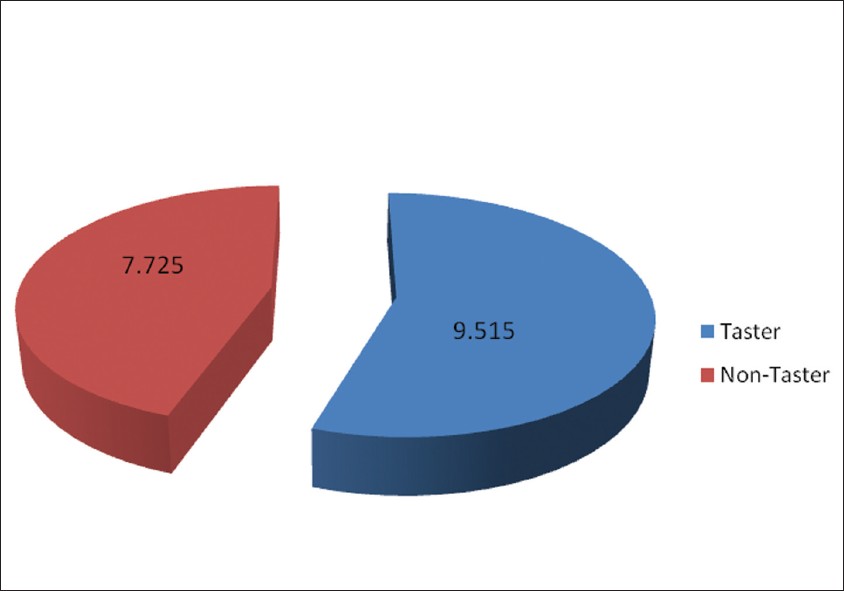
Figure 1: Pie diagram showing the mean dmfs among the taster group