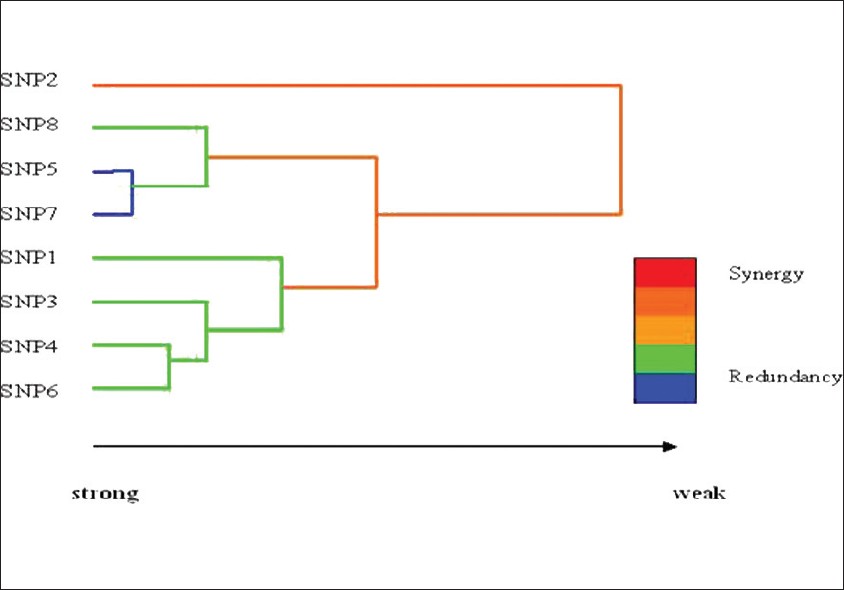
Figure 2: The dendrogram demonstrates the nature of the interactions between SNPs. The colors used in the dendrogram comprise of a spectrum of colors representing a continuum from synergy to redundancy. Red denotes a high degree of interaction, orange denotes a lesser degree of interaction, and green denotes a weak interaction. Blue lines indicate no interaction or redundancy