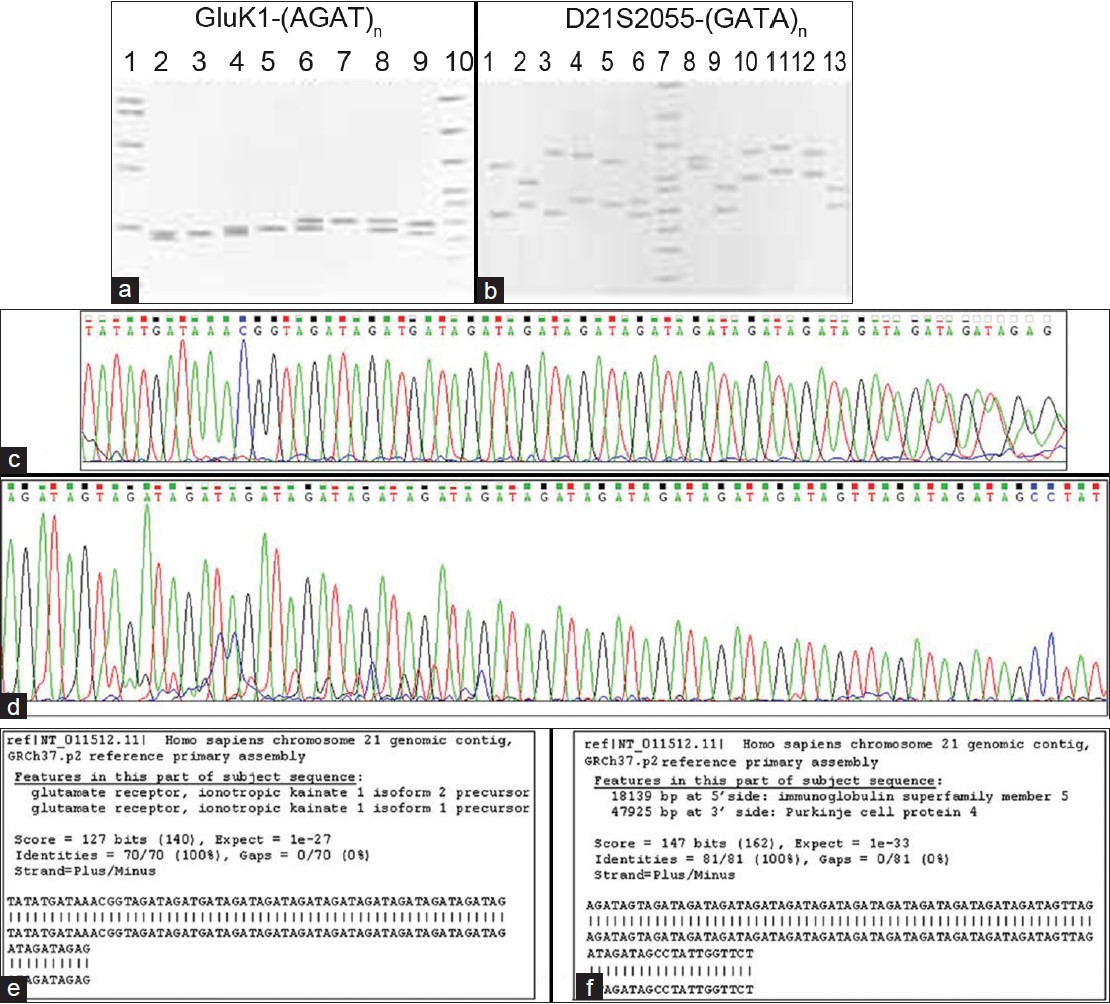
Figure 1 (a,b): (a) Genotypes identified by PCR-based amplification of the GluK1-(AGAT)n polymorphism. 'A' represents followed by polyacrylamide gel electrophoresis allele and subscript denotes number of repeats. Lane-1 ƒÓ X174DNA/HaeIII digest; lane-2 A8A9; lane-3 A9A9; lane-4 A9A10; lane-5 A10A10;lane-6 A10A11; lane-7 A11A11; lane-8 A9A11; lane-9 A8A10; lane-10 ƒÓ X174DNA/HinfI digest. (b) Genotypes identified by PCR-based amplification of the D21S2055-(GATA)n polymorphism. 'A' represents followed by polyacrylamide gel electrophoresis allele. Lane-1 A1A12; lane-2 A3A9; lane-3 A1A16; lane-4 A5A15; lane-5 A3A13; lane-6 A1A4; lane-7 ƒÓ X174DNA HinfI digest; lane-8 A12A14; lane-9 A2A7; lane-10 A9A18; lane-11 A11A19; lane-12 A10A17; lane-13 A2A6 Figure 1: (c) An electropherogram showing the A10 allele of GluK1-(AGAT)n polymorphism. (d) An electropherogram showing the A12 allele of D21S2055-(GATA)n polymorphism Figure 1: (e) The BLAST data of A10 allele of GluK1-(AGAT)npolymorphism. The data indicates % match and expect value of the given sequence. (f) The BLAST data of A10 allele of D21S2055-(GATA)npolymorphism. The data indicates % match and expect value of the given sequence