Indian J Med Microbiol Close
 

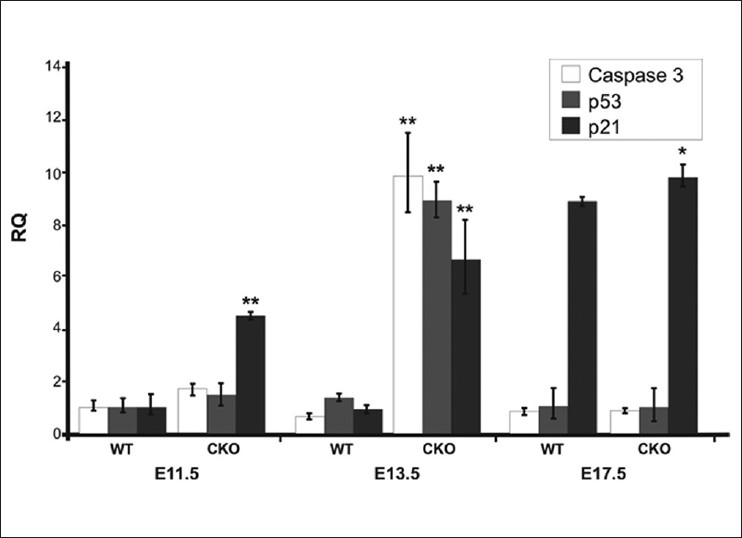
Figure 9: Comparative RT Q-PCR analysis of apoptotic (Caspase 3 and p53) and quiescence (p21) markers in palatal tissue during development. The SDs were within 1% of the mean. *P < 0.01; **P < 0.001. Exact P values are provided within the results section

Figure 9: Comparative RT Q-PCR analysis of apoptotic (<i>Caspase 3</i> and <i>p53</i>) and quiescence (<i>p21</i>) markers in palatal tissue during development. The SDs were within 1% of the mean. <i>*P <</i> 0.01; <i>**P <</i> 0.001. Exact <i>P</i> values are provided within the results section