
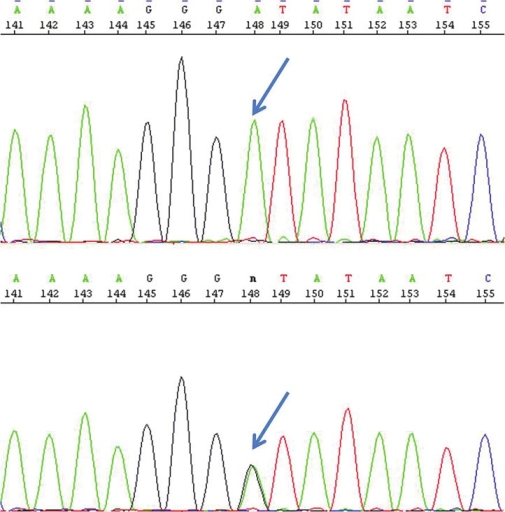
Figure 1: Electropherogram showing homozygosity (top) in the child and heterozygosity (bottom) in the mother for the mutation c.833G>A indicated by arrow
|
|
Close |
|
Figure 1: Electropherogram showing homozygosity (top) in the child and heterozygosity (bottom) in the mother for the mutation c.833G>A indicated by arrow
|
|