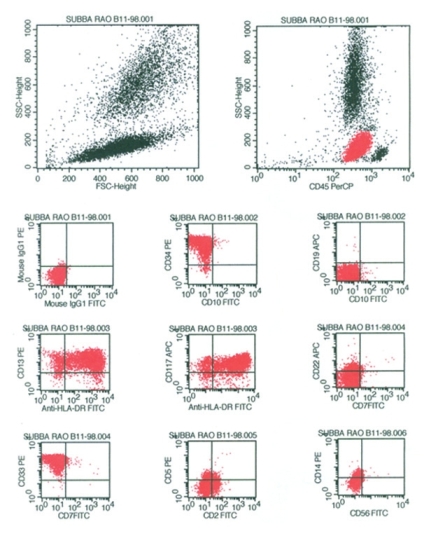
Figure 3: Scatter plots on immunophenotyping - the gated population of neoplastic cells showed bright positivity for HLA-DR, moderate positivity for CD34, CD33, dim to moderate for CD117, CD13 negativity for CD10, CD19, CD7, CD22, CD5, CD2, CD14, CD56