
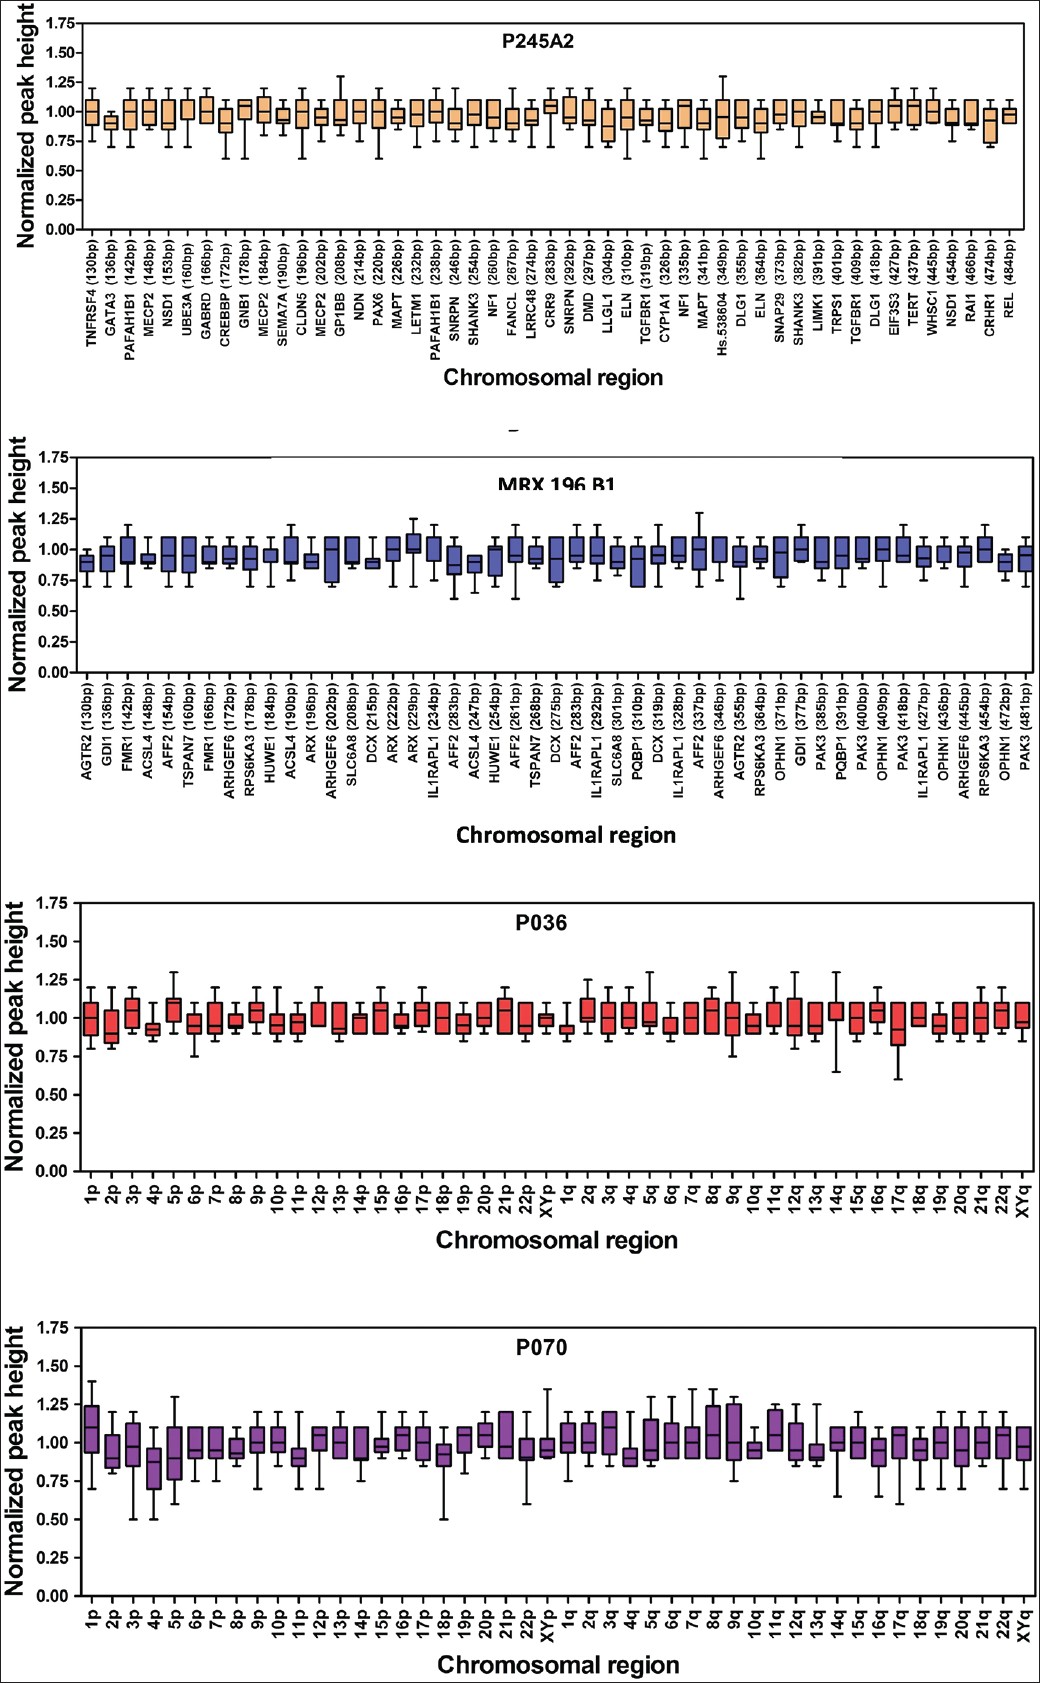
Figure 1: Box plots of the normalized values for each probe from P245A2, MRX106B1, P070 and P036 in the control samples
|
|
Close |
|
Figure 1: Box plots of the normalized values for each probe from P245A2, MRX106B1, P070 and P036 in the control samples
|
|