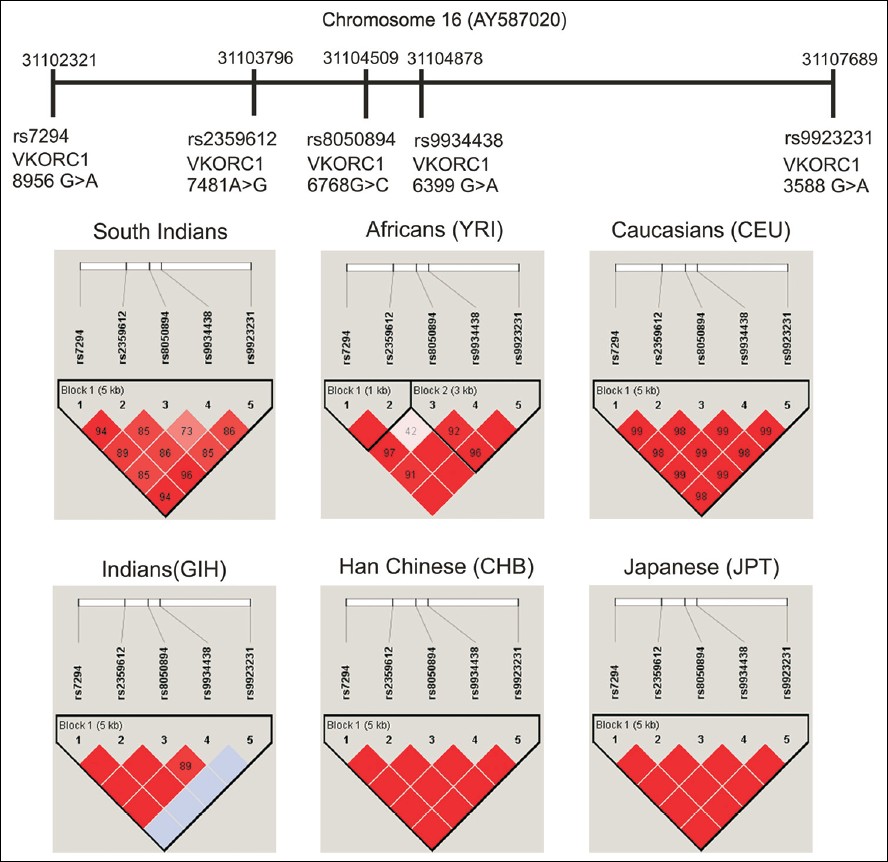
Figure 1: Linkage disequilibrium pattern of vitamin K epoxide reductase complex genetic variants in south Indians and other HapMap populations (The single nucleotide polymorphisms in Chromosome 16 were positioned according to the order and orientation. Each of the variants is given with its specific chromosomal position and the rsID. Red and pink colors represent a very strong LD pattern (D' >0.8) and white color represents moderate to low LD (D' <0.8 to >0.5). The blue color in Indian (GIH) indicates missing genotype data)