
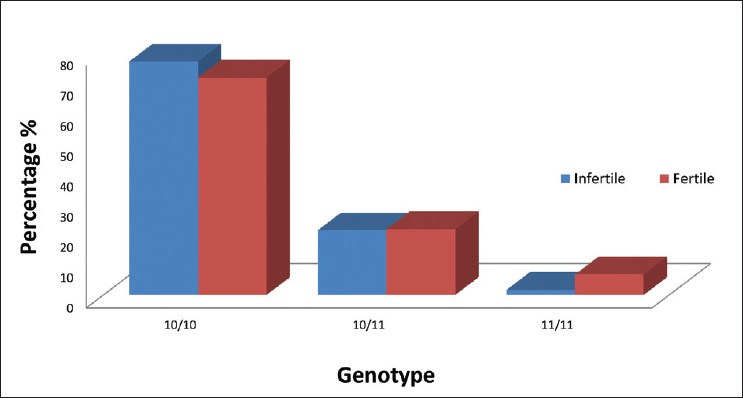
Figure 3: Bar diagram indicating the genotype frequency distribution between infertile and control men of Erode and Nilgiri districts of Tamil Nadu
|
|
Close |
|
Figure 3: Bar diagram indicating the genotype frequency distribution between infertile and control men of Erode and Nilgiri districts of Tamil Nadu
|
|