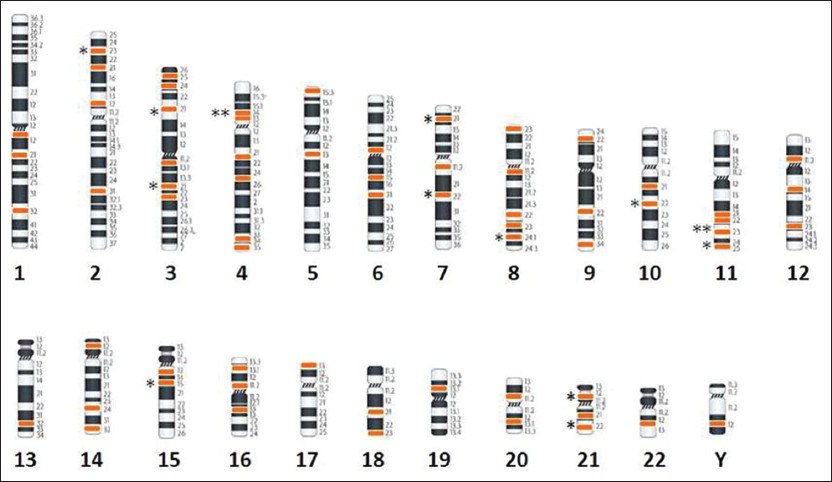
Figure 1: Breakpoint distribution is based on cytogenetic data shown in Table 3. Chromosomes are arranged according to the number except X chromosome as no break point was detected. Below each chromosome the black color numerical indicates the chromosome number and the break points are colored according to the number of break observed in the study. Each star represent on the left of chromosome indicates if a breakpoint was observed in more than one case