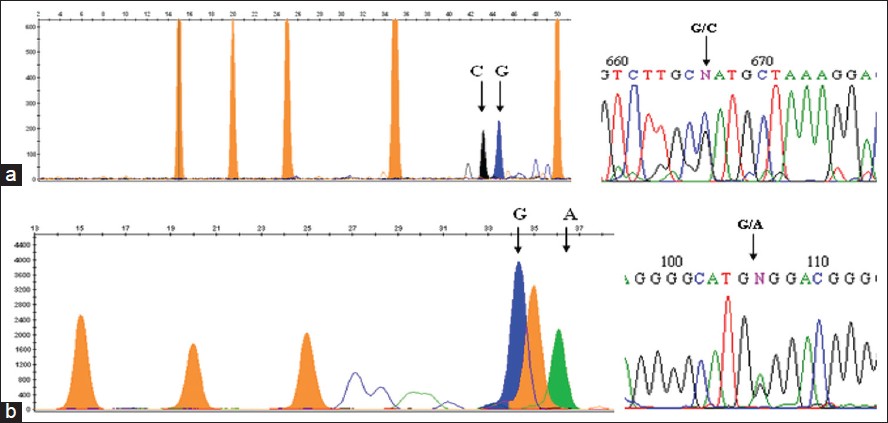
Figure 1: Genotypes have been shown by SNaPshot assay. The genotypes are analysed based on the color of the peak and fragment length. The orange peaks indicate size standard LIZ120GS. (a) Interleukin - 6 - 174G>C genotyping by SNaPshot indicates both G and C allele. The corroborating sequencing electropherogram is adjacent. (b) Tumor necrosis factor alpha - 308G>A genotyping indicates both G and A allele. The sequencing electropherogram of the same is adjacent