
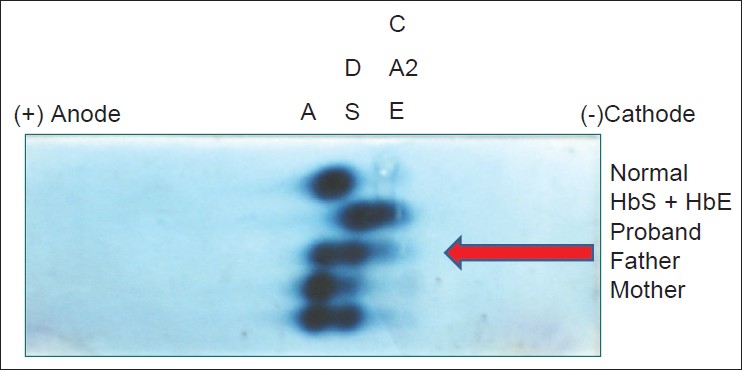
Figure 2: Agarose gel electrophoresis at alkaline pH showed bands in the A, S, and C positions. This was interpreted as HbA in the A position, HbD Punjab in the S position, and HbD Punjab/HbQ India in the C position
|
|
Close |
|
Figure 2: Agarose gel electrophoresis at alkaline pH showed bands in the A, S, and C positions. This was interpreted as HbA in the A position, HbD Punjab in the S position, and HbD Punjab/HbQ India in the C position
|
|