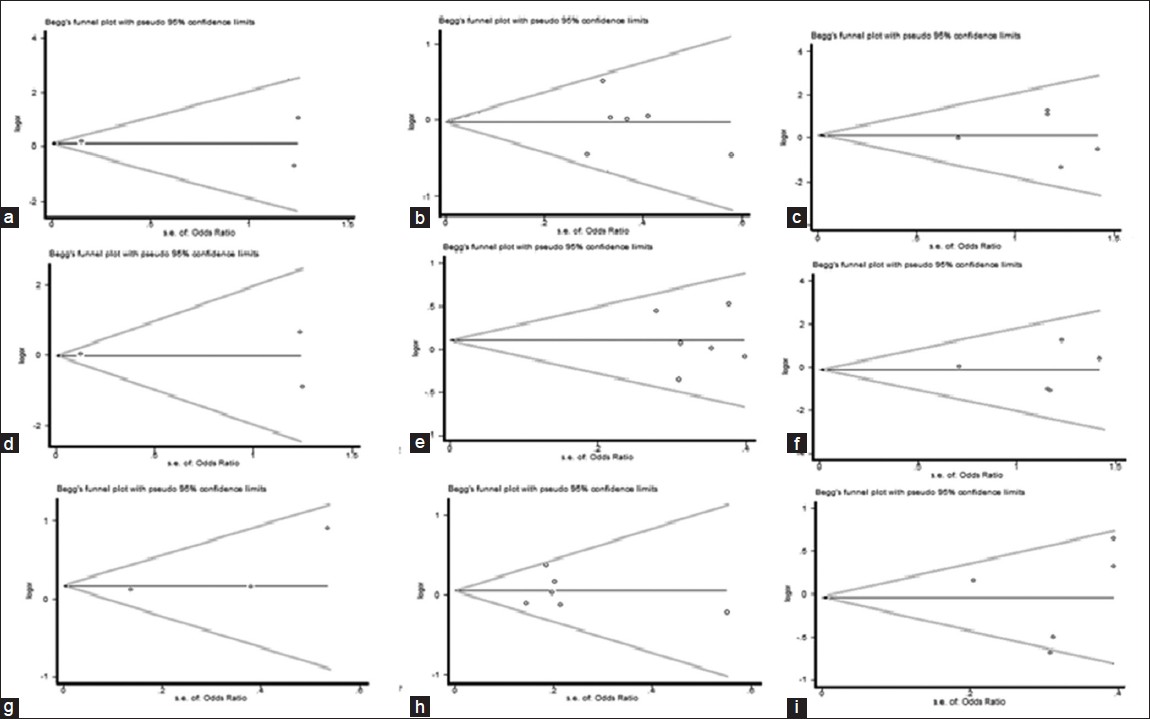
Figure 8: Begg's funnel plot of the Egger's test of allele comparison for publication bias (top) additive model of Arg194Trp (Trp/Trp vs. Arg/Arg), (middle) dominant model (Trp/Trp vs. Arg/Arg+ Arg/Trp) and (bottom) recessive model (Trp/Trp + Arg/Trp vs. Arg/Arg); first row is a subgroup analysis in Caucasian population (a - c); second row is a subgroup analysis in Asian population (d - f); Third row is a subgroup analysis in other population (g - i)