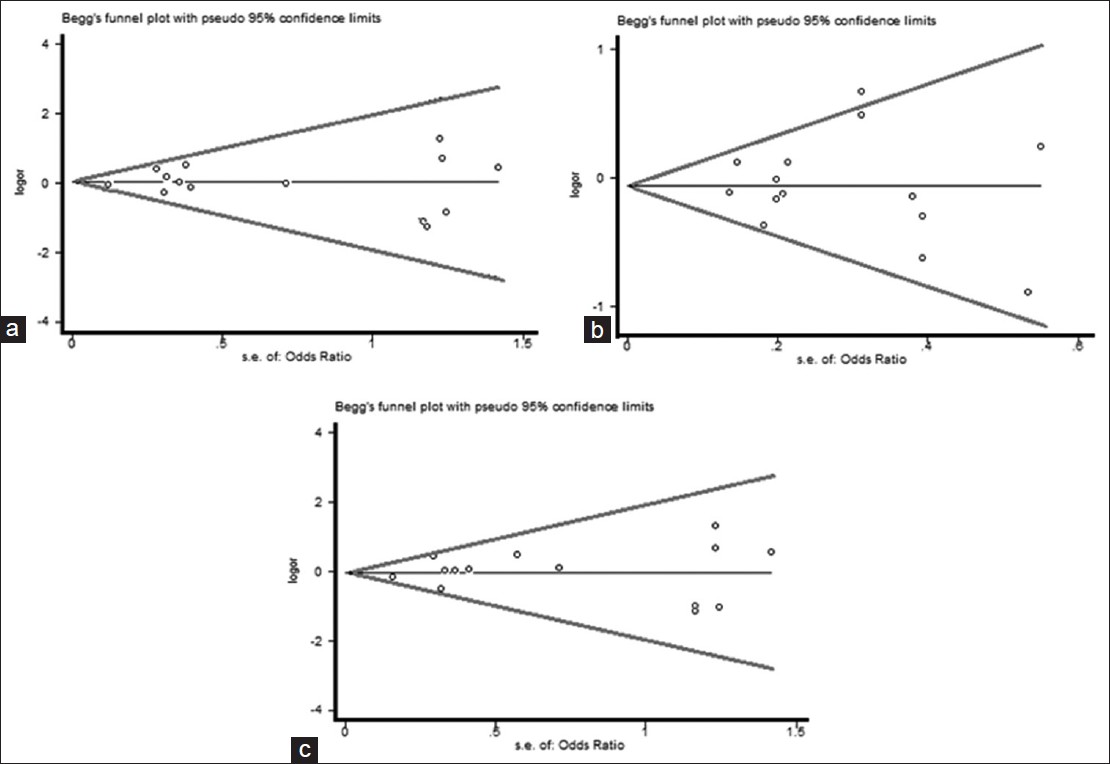
Figure 9: Begg's funnel plot of the Egger's test of allele comparison for publication bias (top) (right) additive model of Arg399Gln (Gln/Gln vs. Arg/Arg), (middle) dominant model (Gln/Gln vs. Arg/Arg+ Arg/Gln) and (bottom) recessive model (Gln/Gln + Arg/Gln vs. Arg/Arg)