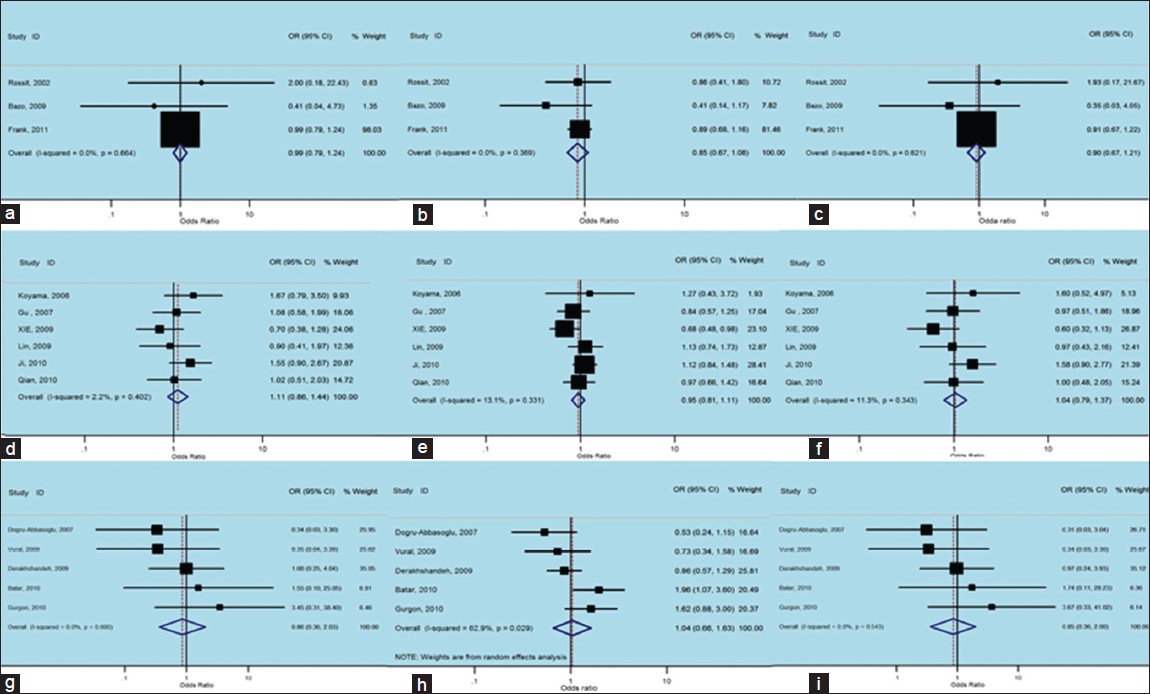
Figure 3: Forest plots of odds ratios with 95% confidence interval for X - ray repair cross - complementing group 1 polymorphisms and risk of non - carcinogenic disease (right) recessive model of Arg194Trp (Trp/Trp vs. Arg/Arg), (middle) dominant model (Trp/Trp vs. Arg/Arg+ Arg/Trp) and (left) additive model (Trp/Trp + Arg/Trp vs. Arg/Arg); first row is a subgroup analysis in Caucasian population under an fixed - effects (FEs) model (a - c); second row is a subgroup analysis in Asian population under an FEs model (d - f); third row is a subgroup analysis as other population under an FEs model (g and i) and random-effects