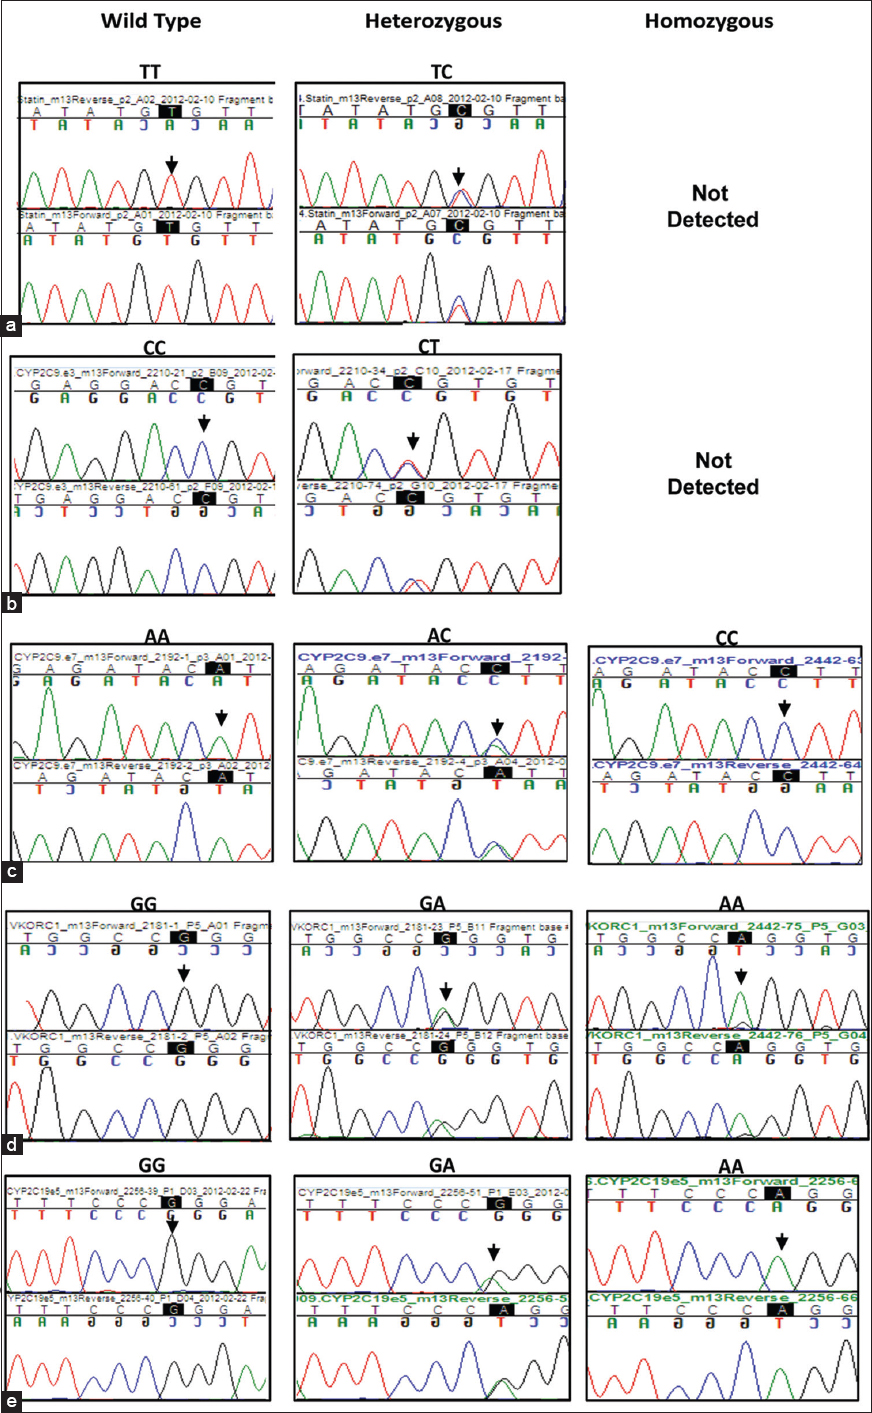
Figure 3: Chromatogram showing the presence of different variants in the genes tested: (a) SLCO1B1 (c. 521T > C) (b) CYP2C9*2 (c. 430C > T)c) CYP2C9*3 (c. 1075A > C) (d) VKORC1 (c.-1639 G > A)e) CYP2C19*2 (c. 681G > A, exon 5). Chromatogram of the region flanking each variant is highlighted as well as indicated by an arrow over the chromatogram