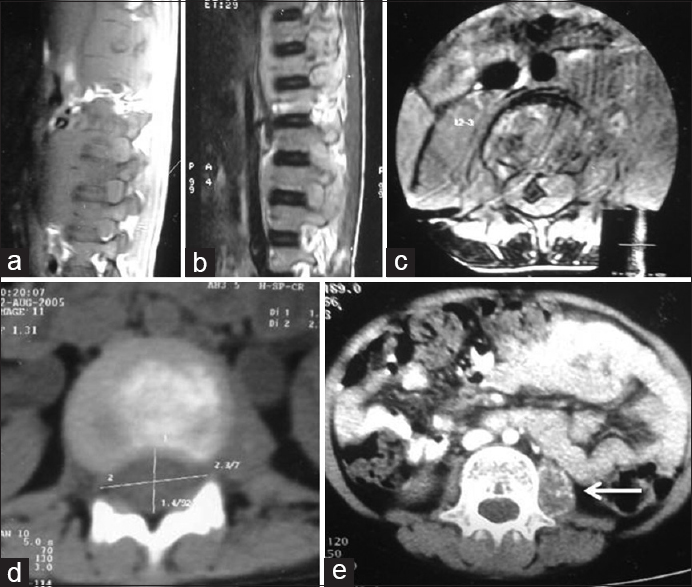
Figure 1: Magnetic resonance imaging images of dorsolumbar spine (axial and sagittal section) shows destruction of vertebrae L1, L2, and L3 with thecal compression (a-c); contrast-enhanced computer tomography scan showing osteolytic lesion involving the lumbar vertebra with cord compression (d), irregular calcification involving the left psoas muscle (arrow) (e)