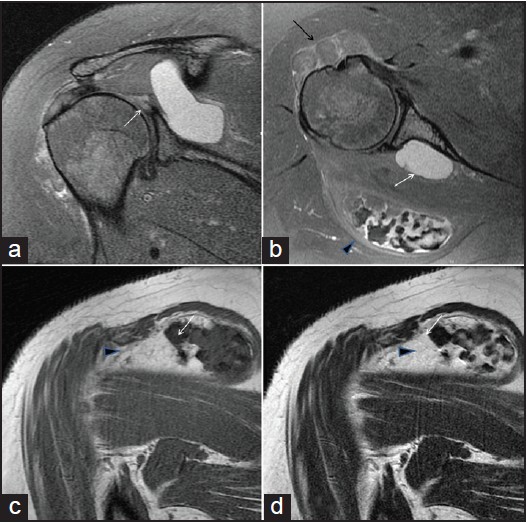
Figure 2: Oblique coronal (a) and axial (b) fat suppressed proton density, oblique coronal T1-weighted (c) and T2-weighted magnetic resonance images (d). (a) There is T2 high signal intensity (short arrow) at posterosuperior labrum, suggesting labral tear. (b) Large T2 high signal intensity cystic lesion (white arrow) is seen adjacent to the labral tear extending into spinoglenoid notch, suggesting paralabral ganglion cyst. A fatty mass is seen between anterolateal cortex of the humeral head and anterior belly of the deltoid muscle, indicating intramuscular lipoma (black arrow). Another encapsulated mass is also seen in intermuscular space between infraspinatus and deltoid muscles (arrow head). (c and d) Arrow heads in c and d indicates encapsulated mass as seen b. It had abundant villous projections on the medial portion. It also had multiple rings like or round low signal intensities on all pulse sequences with background low signal intensity on T1-weighted image and high signal intensity on T2-weighted image. This represents calcification arising from chondroid matrix (white arrow)