Int J Shoulder Surg Close
 

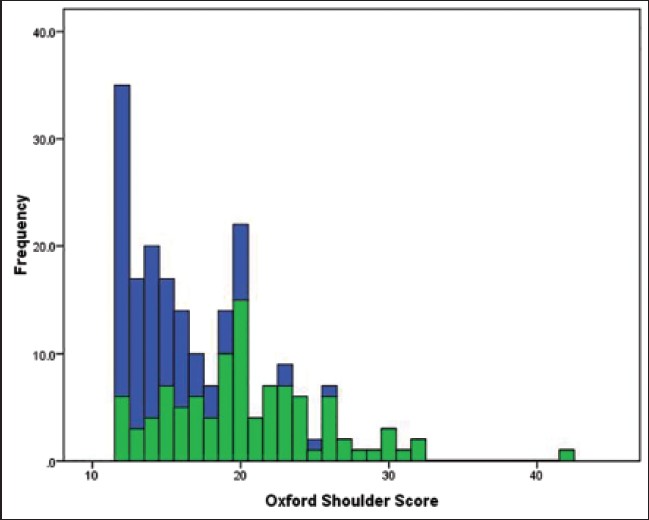
Figure 1: A histogram demonstrating the variation in the OSS according for all patients (n = 202). Overall there is a skewed distribution (skewness 0.97 and Kurtosis 1.1), but on subgroup analysis patients aged 60 yeas old or more (green) demonstrated a normal distribution

Figure 1: A histogram demonstrating the variation in the OSS according for all patients (<i>n</i> = 202). Overall there is a skewed distribution (skewness 0.97 and Kurtosis 1.1), but on subgroup analysis patients aged 60 yeas old or more (green) demonstrated a normal distribution