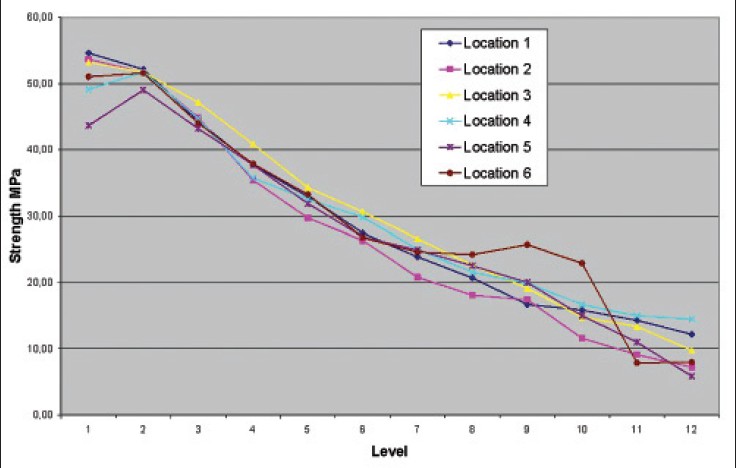
Figure 3: Penetration test curves with penetration strength from 6 different locations of a humeral head specimen from a 65-year-old male. The level markers indicate consecutive 1 mm depth intervals below the subchondral plate. Note that maximum strength is connected with the subchondral plate. Note also the rapid decline in bone strength below the subchondral plate. Locations 2 and 3 represent the center of the humeral head