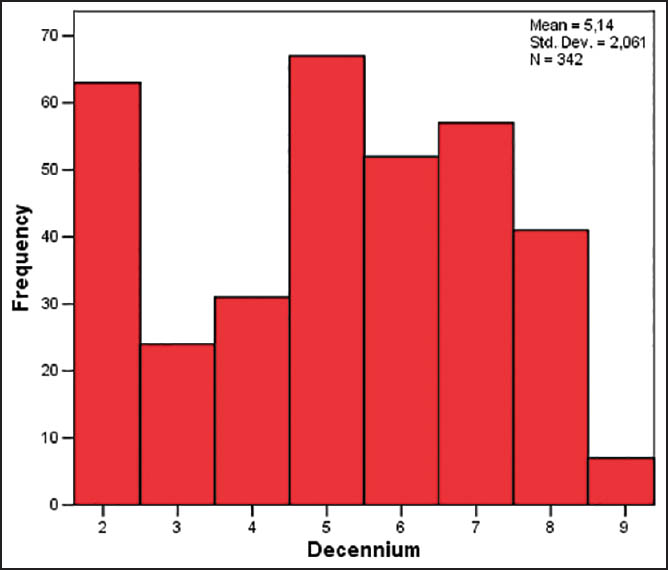
Figure 2: Histogram illustrating the age distribution in each 10 year age group (Groups I-IV pooled)