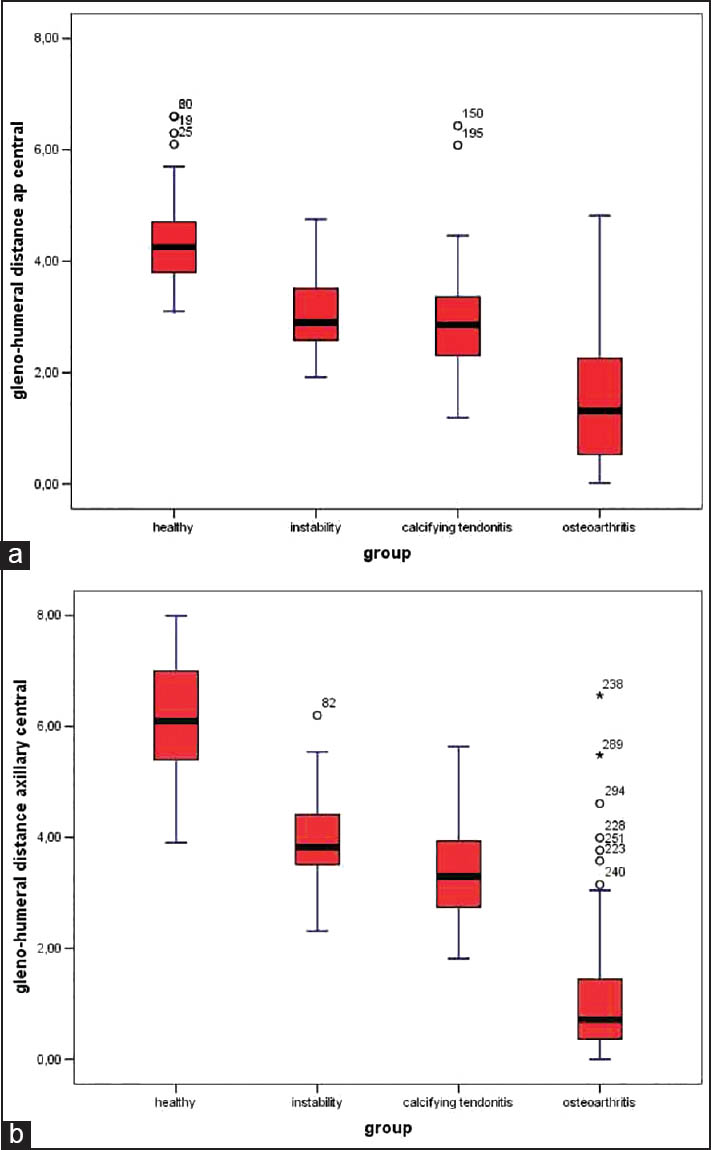
Figure 3: Box- and -whisker plot shows the glenohumeral distance for the pooled data of Groups I-IV at different ages (e.g., 10-19 years = second decennium) at the central level in the (a) anteroposterior and (b) axillary projections in millimeters. The horizontal line in the middle of each box indicates the median, and the top and bottom borders of the box mark the 75th and 25th percentiles, respectively. The whiskers mark the 90th and 10th percentiles