
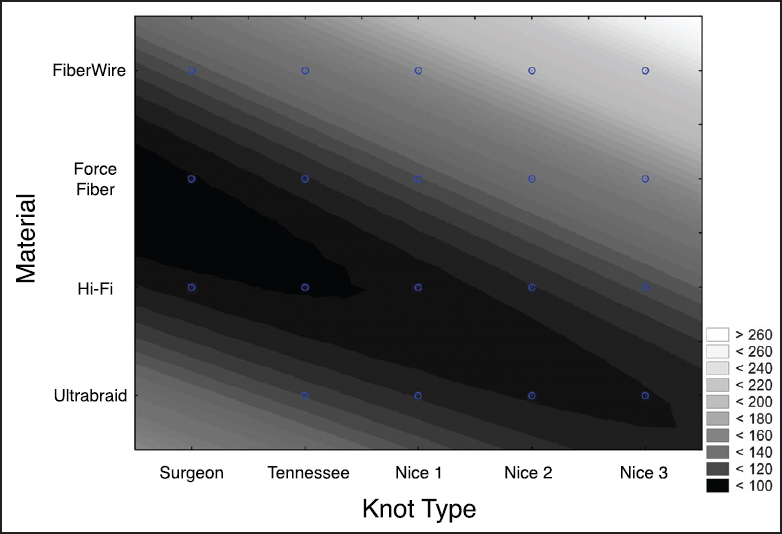
Figure 5: Contour plot of load at clinical failure (N). The knot type is listed on the horizontal axis while the suture material is on the vertical axis. The strongest failure load is shown in white
|
|
Close |
|
Figure 5: Contour plot of load at clinical failure (N). The knot type is listed on the horizontal axis while the suture material is on the vertical axis. The strongest failure load is shown in white
|
|