|
 
 |
| ORIGINAL ARTICLE |
|
| Year : 2014 | Volume
: 2
| Issue : 2 | Page : 90-96 |
|
Stress appraisal in periodontium of maxillary first molar using various intrusive forces: A finite element analysis study
Neetu Dabla1, Tarun Singh Phull2, P Narayana Prasad3, Nimme Rawat3
1 Department of Orthodontics & Dentofacial Orthopaedics, ITS Dental College and Hospital, Greater Noida, India
2 Department of Orthodontics & Dentofacial Orthopaedics, Kalka Dental College, Meerut, Uttar Pradesh, India
3 Department of Orthodontics & Dentofacial Orthopaedics, Seema Dental College and Hospital, Rishikesh, Uttarakhand, India
| Date of Web Publication | 22-Apr-2014 |
Correspondence Address:
Tarun Singh Phull
Department of Orthodontics and Dentofacial Orthopaedics, Kalka Dental College, Meerut, Uttar Pradesh
India
 Source of Support: None, Conflict of Interest: None  | Check |
DOI: 10.4103/2321-3825.131120

Introduction: Maxillary molar intrusion has been regarded as one of the difficult orthodontic tooth movements when prevention of undesirable movement and root resorption are empirically considered. The purpose of the study was to evaluate the effects of various intrusive forces on maxillary first molar using - finite element method. Materials and Methods: Geometric model of maxillary 1 st molar was generated using software ANSYS Workbench 11. The loading condition was designed to mimic conventional orthodontic tooth movement which was subjected to three different intrusive force magnitudes via 150 g, 180 g and 210 g and was put through finite element analysis (FEA). Results: The results were suggested high stress concentration at furcation level of the tooth and compression was seen in apical third of root area of the periodontal ligament (PDL) except in palatal side of palatal root. Conclusion: The furcation area of the tooth is most prone to root resorption and compression was observed in apical third of all root area of PDL except in palatal side of palatal. Displacement at cervical region in palatal side of PDL, at central fossa of the tooth and at the cervico-palatal region of alveolar bone. The results gained through FEA should be integrated with the clinical experiences to maximize accuracy. Keywords: Displacement, finite element analysis, furcation, molar intrusion, periodontal ligament
How to cite this article:
Dabla N, Phull TS, Prasad P N, Rawat N. Stress appraisal in periodontium of maxillary first molar using various intrusive forces: A finite element analysis study. J Orthod Res 2014;2:90-6 |
How to cite this URL:
Dabla N, Phull TS, Prasad P N, Rawat N. Stress appraisal in periodontium of maxillary first molar using various intrusive forces: A finite element analysis study. J Orthod Res [serial online] 2014 [cited 2018 Mar 6];2:90-6. Available from: http://www.jorthodr.org/text.asp?2014/2/2/90/131120 |
| Introduction | |  |
Orthodontic tooth movement is a complex procedure that occurs as a sequel to various biomechanical changes in periodontium. Magnitude and direction of forces should be considered to prevent undesirable movement and root resorption. [1],[2] Supra-eruption of maxillary molars usually results from early loss of antagonistic teeth. The elongated dentoalveolar process may induce problems such as functional disturbances and occlusal interferences and cause great difficulty during prosthetic reconstruction. Conventional options include coronal reduction of molar crown-which requires root canal therapy - and crown restorations or posterior subapical osteotomy with risk of general anesthesia and high cost. [3]
Surgical miniplates [4] and miniscrews [5],[6] is now growing in popularity because of its ability to provide absolute anchorage. A study by Kuroda et al. [7] used titanium screw anchorage treat open bites and stated that their results were similar to those obtained by two-jaw orthognathic surgery.
Studies about biomechanical effects such as stress, strain and displacements on teeth and the surrounding tissues are limited. [8] In-vivo studies are not sufficient in assessing biomechanical effects such as stress and strain, finite element analysis (FEA), a valuable option for evaluation of biomechanical factors in orthodontics. The finite element method (FEM) is a highly precise technique used to analyze structural stress. Used in engineering for years, this method uses the computer to solve large equations to calculate stress on the basis of physical properties of the structure being analyzed.
FEA is a numeric method with which stress, strain and deformation of structures with complex geometries can be studied in various loading and boundary conditions. Its philosophy is based on dividing complicated structures into manageable pieces called elements. FEM has the ability to include heterogeneity of tooth material and irregularity of tooth contour in the model design and relative ease with which loads can be applied at different directions and magnitudes for a more complete analysis.
The purpose of this study was to elucidate stress and displacement in the periodontal ligament (PDL), tooth and alveolar bone by applying three different intrusive force - 150 g, 180 g and 210 g - using FEMs.
| Materials and Methods | | |
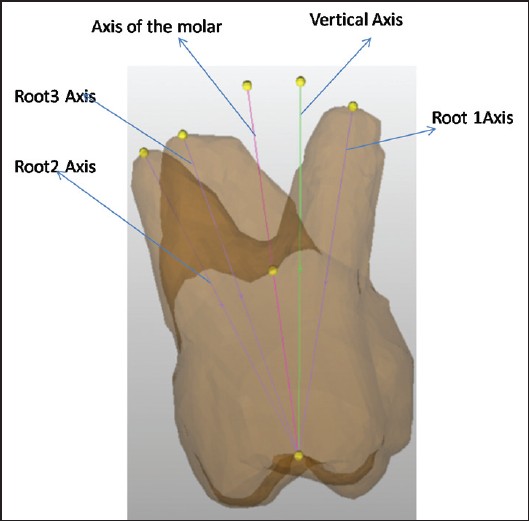
A geometric model was constructed using ideal tooth dimensions of the maxillary molar. [9] Dimensions of tooth were as follows, crown length 7.5 mm, mesio-distal width at cervix 8 mm and labiolingual width 10 mm, root length of buccal roots 12 mm (mesio buccal and disto buccal) and palatal root 13 mm [Figure 1]. Construct PDL of 0.25 mm around it with cancellous bone and hard bone of 1.4 mm each boundaries around it [Figure 2].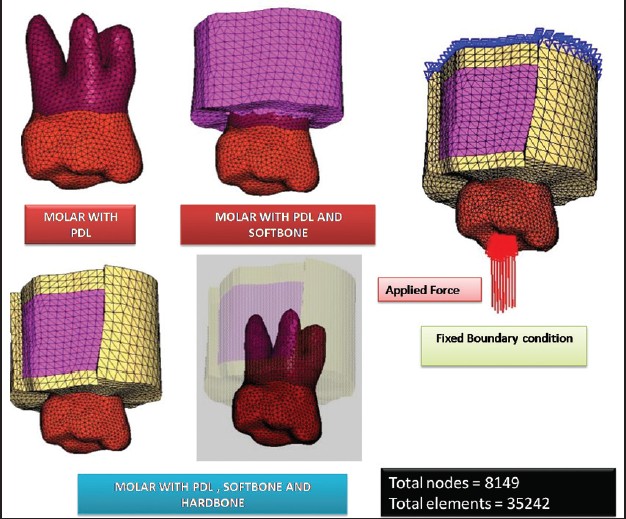 | Figure 2: Three-dimensional finite element model of maxillary first molar along with PDL and alveolar bone
Click here to view |
This geometric model was converted into finite element model. The finite element modeling is representative of geometry in terms of a finite number of elements and nodes. This process is called as discretization. The main idea behind discretization is to improve the accuracy of results. Finite element model was created using hypermesh software using three-dimensional-4 noded tetrahedral elements [Figure 3] and [Figure 4]. The software used for geometric modeling was ANSYS Workbench 11 (403 MSX Tower 2, Alpha 1, Greater Noida).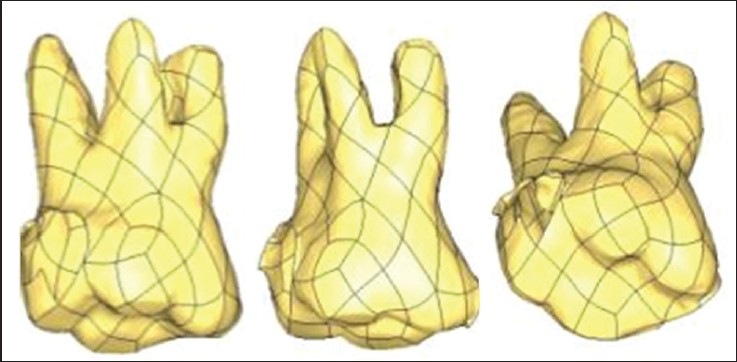 | Figure 3: Three-dimensional model of maxillary molar using mimic software
Click here to view |
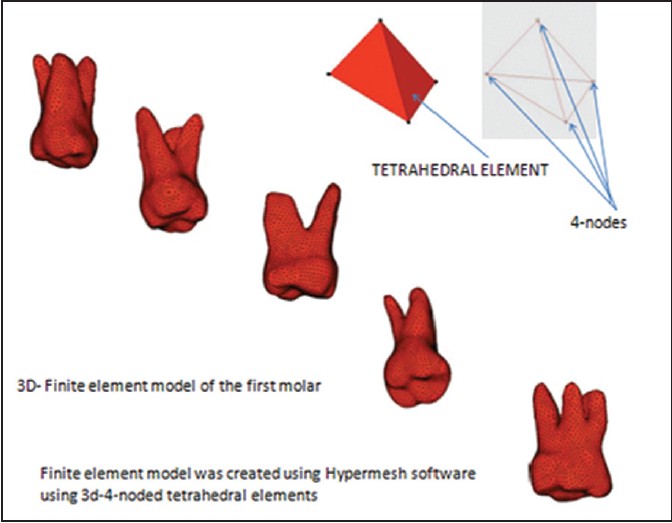 | Figure 4: Three-dimensional finite element model of maxillary first molar
Click here to view |
Total nodes = 8149; Total elements = 35242.
The different structures involved in this study include teeth, the PDL and alveolar bone. The material properties used are derived by McGuinness et al.[10] and were also used in finite element studies done by Tanne et al.[11] These materials properties were the average values as listed in [Table 1].
The nodes attached to the area of the outer surface of bone were fixed in all directions to avoid free body movement of a tooth.
The loading condition was designed to mimic conventional orthodontic tooth movement. Three different types of loads were used to bring about intrusion 150 g, 180 g and 210 g force. By using FEM, the initial vertical displacement and von-mises stress distribution were calculated.
| Results | | |
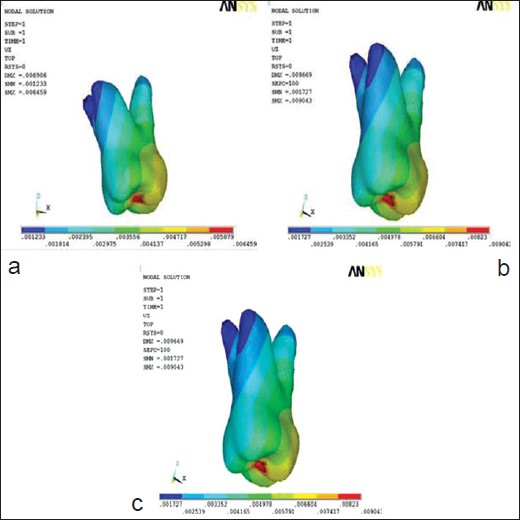
Various contours through the displacement contours, maximum principal stress and von-mises stress generated were calculated for PDL, tooth and alveolar bone respectively when intrusive forces of 150 g, 180 g and 210 g are applies on the maxillary first molar [Figure 5],[Figure 6],[Figure 7],[Figure 8],[Figure 9],[Figure 10],[Figure 11],[Figure 12] and [Figure 13].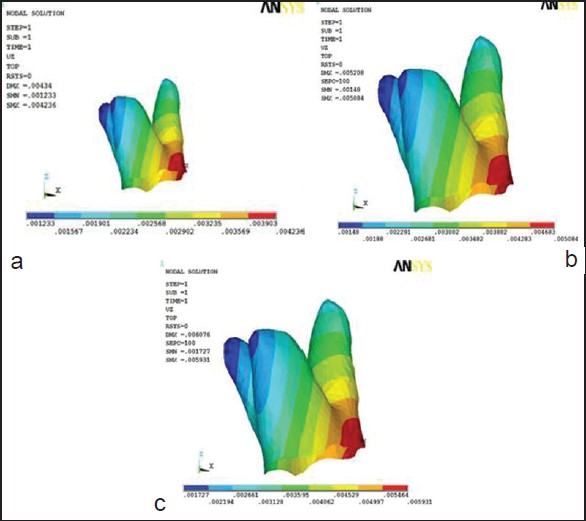 | Figure 5: Displacement of periodontal ligament in Z-axis (a) at 150 g force (b) at 180 g force (c) at 210 g
Click here to view |
 | Figure 6: Displacement in tooth in Z-axis (a) at 150 g force (b) at 180 g force (c) at 210 g
Click here to view |
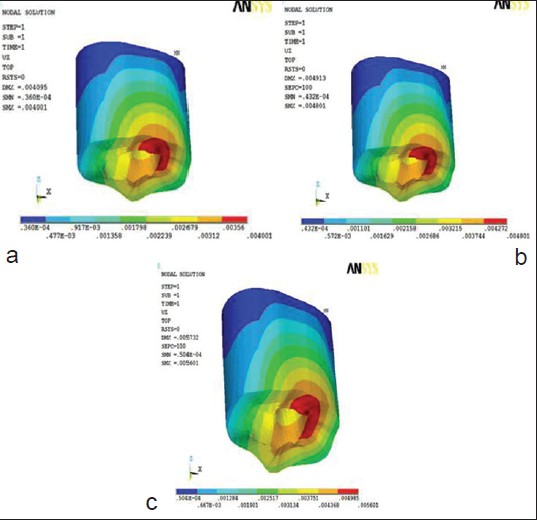 | Figure 7: Displacement of alveolar bone in Z-axis (a) at 150 g force (b) at 180 g (c) at 210 g
Click here to view |
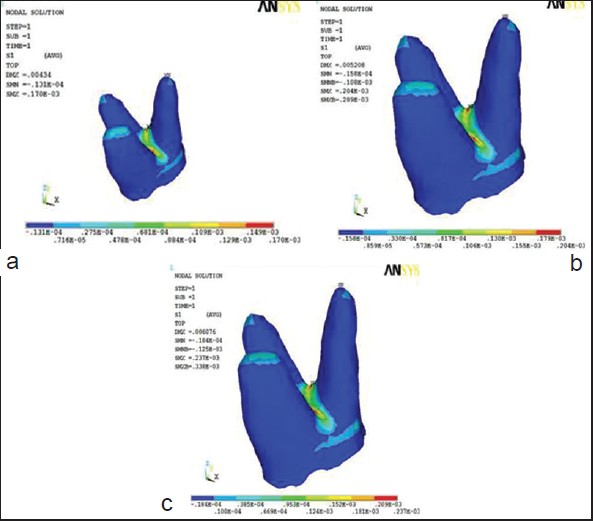 | Figure 8: Maximum principal stress contours in periodontal ligament (a) at 150 g (b)180 g and (c) 210 g
Click here to view |
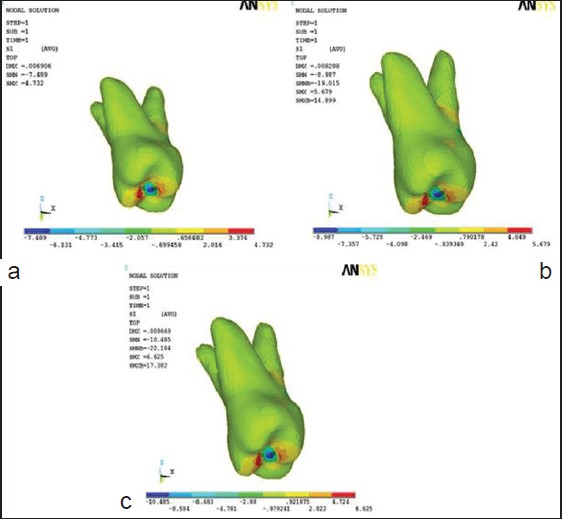 | Figure 9: Maximum principal stress contours in tooth (a) at 150 g (b) at 180 g (c) at 210 g
Click here to view |
 | Figure 10: Maximum principal stress in alveolar bone (a) at 150 g (b) at 180 g and (c) at 210 g
Click here to view |
 | Figure 11: von-mises stress contours in periodontal ligament (a) at 150 g force (b) at 180 g force (c) at 210 g force
Click here to view |
 | Figure 12: Von-mises stress in tooth (a) at 150 g force (b) at 180 g force (c) at 210 g force
Click here to view |
 | Figure 13: Von-mises stress in alveolar bone (a) at 150 g force (b) at 180 g force (c) at 210 g
Click here to view |
Displacement Contour
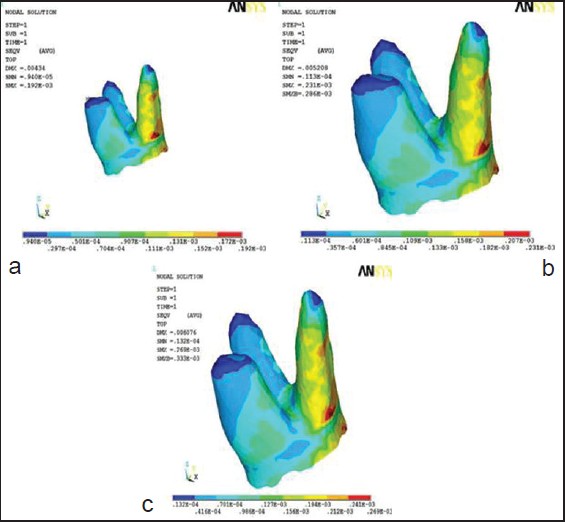
The displacement was seen in all three axes but the maximum displacements in the periodontium have been depicted in figures. In PDL, as force was applied in the vertical direction, it resolved in three directions: x, y and z axes respectively. The amount of maximum displacement varied from 1.4 × 10⁻³ to 2 × 10⁻³ mm at cervical region at the mesial side of PDL when force was applied in x-axis or buccolingual direction and increased from 150 g to 180 g to 210 g. Amount of displacement varied from 0.5 × 10⁻³ to 0.75 × 10⁻³ mm at apical region of palatal root of PDL when force was applied in y-axis or mesiodistal direction and increased from 150 g to 180 g to 210 g. Amount of displacement varied from 4.2 × 10⁻³ to 5.9 × 10⁻³ mm at cervical region in palatal side of PDL when force was applied in z-axis or axial/vertical direction and increased from 150 g to 180 g to 210 g [Figure 5]a-c.
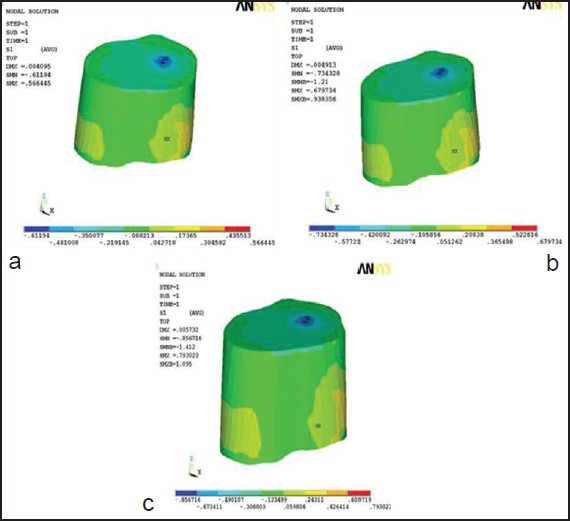
On the application of force in the vertical direction, tooth is displaced in three directions - x, y and z axis respectively. Displacement was not equal in all cusp of tooth as tooth was inclined mesiolingually, was not at the same level from occlusal surface maximum displacement varied from 3.5 × 10⁻³ to 4.9 × 10⁻³ mm at buccal cusp tip when force was applied in x-axis or buccolingual direction and increased from 150 g to 180 g to 210 g. Maximum displacement varied from 0.5 × 10⁻³ to 0.8 × 10⁻³ mm at mesiobuccal cusp tip when force was applied in y-axis or mesiodistal direction and increased from 150 g to 180 g to 210 g. Maximum displacement varied from 6.4 × 10⁻³ to 9 × 10⁻³ mm at central fossa when force was applied in z-axis or axial/vertical direction and increased from 150 g to 180 g to 210 g [Figure 6]a-c.
On loading with three intrusive forces displacement of the tooth was seen mesiobuccal vertically.
In alveolar bone as we apply force in the vertical direction, in alveolar bone it resolved in 3 directions - x, y and z axis respectively. Amount of maximum displacement varied from 1.3 × 10⁻³ to 1.8 × 10⁻³ mm at cervical region of mesiopalatal area of alveolar bone when force was applied in x-axis or buccolingual direction and increased from 150 g to 180 g to 210 g. Amount of maximum displacement varied from 0.89 × 10⁻³ to 1.25 × 10⁻³ mm at palatal region of alveolar bone when force was applied in y-axis or mesiodistal direction and increased from 150 g to 180 g to 210 g. Amount of maximum displacement varied from 4 × 10⁻³ to 5.6 × 10⁻³ mm at cervicopalatalregion of alveolar bone when force was applied in z-axis or axial/vertical direction and increased from 150 g to 180 g to 210 g [Figure 7]a-c.
On loading with 3 intrusive forces displacement of alveolar bone was seen in the cervical region of the mesio-palatal region of alveolar bone.
Maximum Principal Atress Contours
As force was applied in the vertical direction, compression was seen in whole of the PDL except in the area of trifurcation where stretching was seen as a result of tensile forces. Maximum principal stress increased from 0.17 × 10⁻³ to 0.24 × 10⁻³ MPa in trifurcation area of PDL when forces were increased from 150 g to 180 g to 210 g of force [Figure 8]a-c.
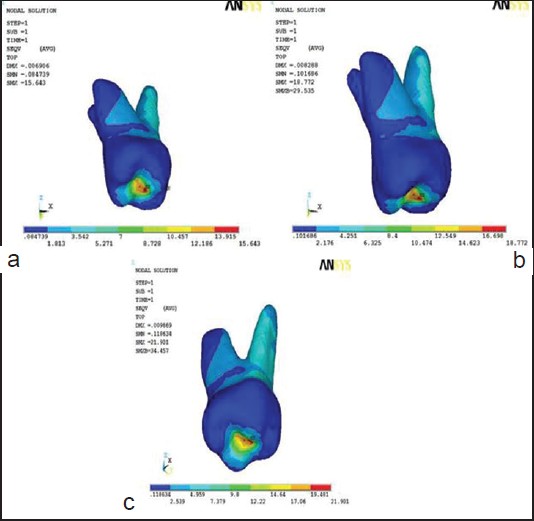
At the tooth level, as forces were applied in the vertical direction, compression occurred only in the area of central fossa. Maximum principal stress increased from 7.48 to 10.48 × 10⁻³ MPa when forces were increased from 150 g to 180 g to 210 g of force [Figure 9]a-c.
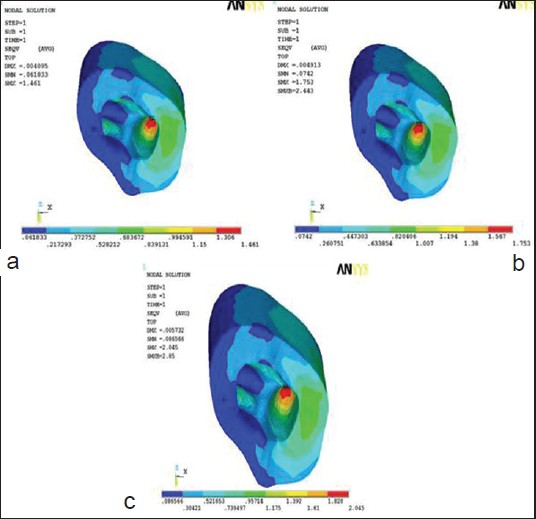
In alveolar bone, in the vertical direction, there was compression in the apical area of bone covering palatal root. Maximum principal stress increased from 0.61 to 0.793 × 10⁻³ MPa when forces were increased from 150 g to 180 g to 210 g of force [Figure 10]a-c.
Von-Mises Stress Contours
In PDL, with force application in the vertical direction, compression was seen in apical third of all root area of PDL except in palatal side of palatal root of PDL area where stretching was seen (tensile forces were generated). Von-mises stress increased from 0.19 × 10⁻³ to 0.27 × 10⁻³ Mpa in trifurcation area of PDL when forces were increased from 150 g to 180 g to 210 g of force [Figure 12]a-c. Application of force in the vertical direction, lead to compression, in all areas of tooth except in central fossa region where tensile forces were generated. Von-mises stress increased from 15.64 to 21.9 × 10⁻³ Mpa in central fossa area of tooth when forces were increased from 150 g to 180 g to 210 g of force [Figure 12]a-c.
In alveolar bone compression was seen in all except in the apical region of alveolar bone covering palatal root where tensile forces were seen where von-mises stress increased from 1.46 to 2.045 × 10⁻³ Mpa when forces are increased from 150 g to 180 g to 210 g of force [Figure 13]a-c.
| Discussion | | |
In the present study, the FEM provided a mathematical model that allowed quantification of displacement and stress patterns in periodontium of maxillary first molar by incorporation of PDL, tooth and alveolar bone. Displacement pattern was seen in all 3-axes (x, y and z) on application of three different intrusive forces.
To avoid root resorption, optimal force(s) have been advocated. Park et al. [12] used 150-250 g, Jeon et al. [13] used 400 g, Erverdi et al. used 200 g, Xun used 150 g. In the present study, 3 force values, i.e., 150 g, 180 g and 210 g were used to calculate stress and displacement generated in the periodontium.
Results showed the displacement of tooth at mesiobuccal area in a vertical direction while displacement was seen in cervico mesio-palatal area of the PDL; the displacement in alveolar bone was seen in the cervical region mesio-palatally. Amount of intrusion seen was 6.4 × 10⁻³ mm for 150 g, 7.7 × 10⁻³ mm for 180 g and 9 × 10⁻³ mm for 210 g of forces applied [Graph 1a-c].
The stress patterns in PDL, tooth and alveolar bone have been displayed by separate illustrations, so that the complex responses of these tissues to different loads could be readily compared. Von-mises stress patterns showed that in PDL, compression took place at the apical third of the complete root area except at the palatal side of palatal root where stretching was observed to take place due to tensile forces. Tooth compression was observed at the majority of tooth area except at the central fossa region where tensile forces were seen. At the alveolar bone region, compression was observed at all places except in the apical region covering the palatal root where tensile forces were present.
When quantifying the maximum principal stress in PDL, compression was seen in the whole area of PDL except in furcation area where stretching was seen due to tensile forces. For the tooth, compression was seen in the area of central fossa while in alveolar bone compression resulted in the apical area of bone covering palatal root [Graph 2a-c].
The results were similar to that of Jeon et al. [13] who observed high stress concentration on the root surface at furcation level, was in contrast to anterior teeth that display a greater apical concentration. [14],[15],[16],[17] In a recent clinical study [15] maxillary central incisors showed the highest incidence (over 60%) of apical resorption as a result of orthodontic treatment while maxillary molar showed the least. The maxillary molar with three roots was likely to undergo resoption on the root surface at furcation level that was difficult to infer radiographically.
The viscous nature of PDL comes from the cervicular fluid and its elastic behavior from the PDL fibers. The anisotropy resulted from the orientation of fibers. Studies have been done to examine anisotropy [18] and viscoelastic behavior [19] of PDL which is characterized by time-dependent strain [20] but have been limited to 2-D analysis.
In the present study, static FEA only simulated the initial tooth movement in periodontal membrane and the initial stress distribution along the root surface. During the treatment cycle, ongoing movements and stresses could differ due to changes in force systems and biologic responses. Other limitations were:
- Use of physical properties of the tissues, which would normally alter clinically through the histologic process and
- The assumptions that periodontal membrane as homogenous, isotropic and uniform thickness.
These limitations could cause differences between clinical and simulation studies. However, similarities between the results of the present study and the clinical studies with parallel mechanics have shown that finite element models generated are accurate enough to simulate clinical conditions, in accordance with Yao et al. [21] and Ammar et al. [22]
| Conclusion | | |
Resorption during intrusion is one of the factors among various tooth movements which is considered to be detrimental. It is well established that the intrusive forces generate stress which cause changes in the surrounding tooth structure and its periodontium.
- In the present study, a high stresses concentration on the root surface area at the furcation level was observed, which was in contrast to anterior teeth that display a greater apical concentration; these areas were, therefore, prone to resorption.
- Heavy forces tend to produce more orthodontically induced inflammatory resorption when compared with light forces. Comprehensive orthodontic treatment causes increased incidence and severity of root resorption especially when treatment is carried over a prolonged period of time.
- In order to obtain a balanced intrusion, root surface area should be considered when determining the appropriate forces. Over the years FEA have been used as a tool for simulating various orthodontic movements and stress patterns.
- FEA of maxillary 1 st molar intrusion only simulates the initial tooth movement in periodontal membrane and the initial stress distribution along the root surface.
- Similarities between the results of the maxillary molar intrusion and the clinical studies with parallel mechanics shows that finite element models generated are accurate enough to simulate clinical conditions.
- Ideally, the results gained through FEA should be integrated with clinical experiences to maximize accuracy.
| References | | |
| 1. | Park HS, Jang BK, Kyung HM. Maxillary molar intrusion with micro-implant anchorage (MIA). Aust Orthod J 2005;21:129-35. 
|
| 2. | Kravitz ND, Kusnoto B, Tsay TP, Hohlt WF. The use of temporary anchorage devices for molar intrusion. J Am Dent Assoc 2007;138:56-64.
|
| 3. | Heravi F, Bayani S, Madani AS, Radvar M, Anbiaee N. Intrusion of supra-erupted molars using miniscrews: Clinical success and root resorption. Am J Orthod Dentofacial Orthop 2011;139:S170-5.
|
| 4. | Sherwood KH, Burch JG, Thompson WJ. Closing anterior open bites by intruding molars with titanium miniplate anchorage. Am J Orthod Dentofacial Orthop 2002;122:593-600.
|
| 5. | Creekmore TD, Eklund MK. The possibility of skeletal anchorage. J Clin Orthod 1983;17:266-9.
[PUBMED] |
| 6. | Costa A, Raffainl M, Melsen B. Miniscrews as orthodontic anchorage: A preliminary report. Int J Adult Orthodon Orthognath Surg 1998;13:201-9.
|
| 7. | Kuroda S, Katayama A, Takano-Yamamoto T. Severe anterior open-bite case treated using titanium screw anchorage. Angle Orthod 2004;74:558-67.
|
| 8. | Rudolph DJ, Willes PMG, Sameshima GT. A finite element model of apical force distribution from orthodontic tooth movement. Angle Orthod 2001;71:127-31.
|
| 9. | Wheeler RC. Textbook of Dental Anatomy and Physiology. 7 th ed. Philadelphia: W.B. Saunders; 1949.
|
| 10. | McGuinness NJ, Wilson AN, Jones ML, Middleton J. A stress analysis of the periodontal ligament under various orthodontic loadings. Eur J Orthod 1991;13:231-42.
|
| 11. | Tanne K, Bantleon HP. Stress distribution in the periodontal ligament induced by orthodontic forces. Use of finite-element method. Inf Orthod Kieferorthop 1989;21:185-94.
[PUBMED] |
| 12. | Park YC, Lee HA, Choi NC, Kim DH. Open bite correction by intrusion of posterior teeth with miniscrews. Angle Orthod 2008;78:699-710.
|
| 13. | Jeon PD, Turley PK, Moon HB, Ting K. Analysis of stress in the periodontium of the maxillary first molar with a three-dimensional finite element model. Am J Orthod Dentofacial Orthop 1999;115:267-74.
|
| 14. | Beck BW, Harris EF. Apical root resorption in orthodontically treated subjects: Analysis of edgewise and light wire mechanics. Am J Orthod Dentofacial Orthop 1994;105:350-61.
|
| 15. | Lupi JE, Handelman CS, Sadowsky C. Prevalence and severity of apical root resorption and alveolar bone loss in orthodontically treated adults. Am J Orthod Dentofacial Orthop 1996;109:28-37.
|
| 16. | Baumrind S, Korn EL, Boyd RL. Apical root resorption in orthodontically treated adults. Am J Orthod Dentofacial Orthop 1996;110:311-20.
|
| 17. | Costopoulos G, Nanda R. An evaluation of root resorption incident to orthodontic intrusion. Am J Orthod Dentofacial Orthop 1996;109:543-8.
|
| 18. | Atmaram GH, Mohammed H. Estimation of physiologic stresses with a natural tooth considering fibrous PDL structure. J Dent Res 1981;60:873-7.
[PUBMED] |
| 19. | Middleton J, Jones M, Wilson A. The role of the periodontal ligament in bone modeling: The initial development of a time-dependent finite element model. Am J Orthod Dentofacial Orthop 1996;109:155-62.
|
| 20. | Callister WD. Materials Science and Engineering. New York: John Wiley; 1985.
|
| 21. | Yao CC, Lee JJ, Chen HY, Chang ZC, Chang HF, Chen YJ. Maxillary molar intrusion with fixed appliances and mini-implant anchorage studied in three dimensions. Angle Orthod 2005;75:754-60.
|
| 22. | Ammar HH, Ngan P, Crout RJ, Mucino VH, Mukdadi OM. Three-dimensional modeling and finite element analysis in treatment planning for orthodontic tooth movement. Am J Orthod Dentofacial Orthop 2011;139:e59-71.
|
[Figure 1], [Figure 2], [Figure 3], [Figure 4], [Figure 5], [Figure 6], [Figure 7], [Figure 8], [Figure 9], [Figure 10], [Figure 11], [Figure 12], [Figure 13]
[Table 1]
|


 Search Pubmed for