|
 
 |
| ORIGINAL ARTICLE |
|
| Year : 2014 | Volume
: 2
| Issue : 3 | Page : 156-161 |
|
Evaluation of soft tissue and cortical bone thickness at orthodontic implant sites using computed tomography
BR Arun Kumar1, MB Raghuraj1, Kenneth F. H. Tan2, Rabindra S Nayak3, Azam Pasha3, K Vinay3, Anjali Narayan3
1 Department of Orthodontics and Dentofacial Orthopaedics, Dr. Syamala Reddy Dental College Hospital and Research Centre, Bengaluru, Karnataka, India
2 Department of Orthodontics and Dentofacial Orthopaedics, Oxford Dental College and Hospital, Bengaluru, Karnataka, India
3 Department of Orthodontics and Dentofacial Orthopaedics, M. R. Ambedkar Dental College and Hospital, Bengaluru, Karnataka, India
| Date of Web Publication | 12-Sep-2014 |
Correspondence Address:
M B Raghuraj
Department of Orthodontics and Dentofacial Orthopaedics, Dr. Syamala Reddy Dental College Hospital and Research Centre, #111/1, SGR College Main Road, Munnekolala, Marathalli (Post), Bengaluru - 560 037, Karnataka
India
 Source of Support: None, Conflict of Interest: None  | Check |
DOI: 10.4103/2321-3825.140688

Objectives: The aim of this study is to investigate advantageous to the clinician and patient to carry on a computed tomography (CT) investigation in order to have a successful outcome for using orthodontic implants. Materials and Methods: This study was carried out on a sample of 10 patients (5 male and 5 female patients) aged ranges between 16 and 25 years who reported to the Department of Orthodontics, M.R. Ambedkar Dental College, for the treatment of malocclusion. Using CT, the bucco-palatal thickness of the soft-tissue and cortical bone at the posterior region of the maxilla between 1 st PM and 2 nd PM (Group I), 2 nd PM and 1 st M (Group II) and 1 st M and 2 nd M (Group III) were measured at four different levels, at points a, b, c, d, (soft-tissue) and A, B, C, D (cortical bone) and on the palatal side at points e, f, g, h (soft-tissue) and E, F, G, H (cortical bone) at an interval of 2 mm each. Results: All groups showed soft-tissue thickness was greater on the palatal side than on buccal side and the palatal cortical bone thickness was greater in Group I and III except in Group II where buccal cortical bone was greater. Conclusion: CT has been a reliable tool to assess implant placement sites. It will also help in assessing and avoiding the sinus perforation, root injury, soft-tissue complication, and utilizing appropriate cortical bone thickness. Keywords: Computed tomography, magnetic resonance imaging, implant
How to cite this article:
Arun Kumar B R, Raghuraj M B, Tan KF, Nayak RS, Pasha A, Vinay K, Narayan A. Evaluation of soft tissue and cortical bone thickness at orthodontic implant sites using computed tomography. J Orthod Res 2014;2:156-61 |
How to cite this URL:
Arun Kumar B R, Raghuraj M B, Tan KF, Nayak RS, Pasha A, Vinay K, Narayan A. Evaluation of soft tissue and cortical bone thickness at orthodontic implant sites using computed tomography. J Orthod Res [serial online] 2014 [cited 2018 Feb 19];2:156-61. Available from: http://www.jorthodr.org/text.asp?2014/2/3/156/140688 |
| Introduction | |  |
Anchorage control is one of the most important aspects of orthodontic treatment. The law of Nature that underlies orthodontic tooth movement is Newton's third law of motion- "for every action there is an opposite and equal reaction." In most cases, anchorage is produced within the orthodontic appliance with the strategy to dissipate the reaction forces over as many teeth as possible and thereby control anchorage. Conventional methods of reinforcing anchorage such as lingual arches, Nance buttons, elastics, and headgear have their own limitations and disadvantages. [1],[2],[3],[4]
Modern technologies have elevated implants as the method for absolute orthodontic anchorage, which is a critical consideration when planning treatment for patients with dental and skeletal malocclusions. Critical factors include the quantity (bone volume) and quality (bone density) of alveolar bone for the stability of implants. Common investigation methods, such as clinical examination, orthopantomogram, lateral cephalogram, occlusal and peri-apical radiographs do not provide precise information about the available bone and soft-tissue thickness and also have certain disadvantages like two-dimensional in nature, radiation exposure, overlaps, leading to poor visualization of individual structures and errors due to projection. Thus would be advantageous to the clinician and patient to carry on a computed tomography (CT) investigation in order to have a successful outcome.
In this study, we aimed to evaluate the advantageous to the clinician and patient to carry on a CT investigation in order to have successful outcome for using orthodontic implants.
| Materials and Methods | | |
This study was carried out on a sample of 10 patients (5 male and 5 female patients) aged between 16 and 25 years who reported to the Department of Orthodontics, M.R. Ambedkar Dental College, for the treatment of malocclusion. This group of patients showed a definite indication that they would be benefited by placing an orthodontic mini-implant as a part of the treatment procedure. [5]
Method of Collection of Data
The patients selected had severe bimaxillary protrusion and anterior crowding, requiring maximum anchorage or absolute anchorage with 75-100% of space closure with anterior retraction. All routine diagnostic investigation had been carried out as part of treatment protocol.
A specialized noninvasive diagnostic tool, dental CT (Siemens, Somatom Emotion 6) scan of posterior region of the maxilla between the two premolars (Group I), second premolar and first molar (Group II), first molar and second molar (Group III), in coronal section (cross section) was obtained. The CT scan was performed with puffed cheek technique [6] [Figure 1].
A line drawn through the long axis of the tooth and to this line two more lines were drawn at an angulation of 45° and named as XY and XY 1 on the buccal and palatal sides, respectively (Point X is taken approximately at the cemento-enamel junction). Parallel to these two lines (XY and XY 1 ) soft-tissue and cortical bone thickness were measured in bucco-palatal direction about 2-3 mm away from the alveolar crest on buccal side at points a, b, c, d, (soft-tissue) and A, B, C, D (cortical bone) and on palatal side at points e, f, g, h (soft-tissue) and E, F, G, H (cortical bone) at an interval of 2 mm each respectively [Figure 2].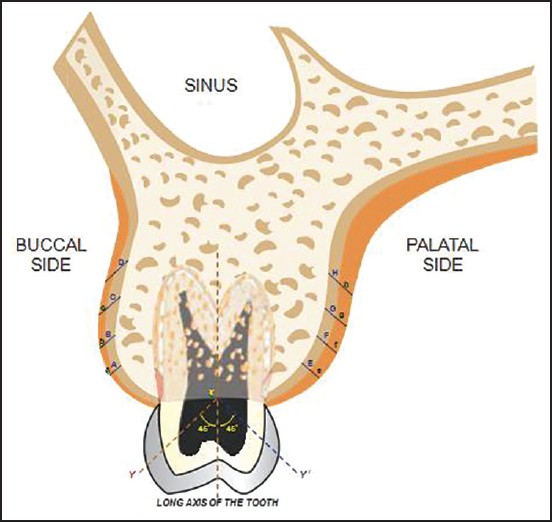 | Figure 2: Schematic representation-coronal section view of structures related during mini-implant placement in maxilla, points marked at different levels
Click here to view |
Statistical Analysis
All the statistical analyses were performed using software namely Statistical Product and Service Solutions (SPSS) 15.0, Stata 8.0, MedCalc 9.0.1 and Systat 11.0 were used for the analysis of the data.
Descriptive statistical analysis has been carried out in the present study. Results on continuous measurements are presented on mean standard deviation (Min-Max) and results on categorical measurements are presented in number (%). Significance is assessed at 5% level of significance. Analysis of variance has been used to find the significance of study parameters between three or more groups of patients, post-hoc Tukey test has been used to find the pair wise significance.
| Results | | |
The bucco-palatal soft-tissue and cortical bone thickness in all the three groups were measured and a total of 48 measurements (24 measurements on buccal and 24 measurements on palatal) were obtained on the computer display monitor with Digital Imaging and Communications in Medicine measuring software tool (in cm) [Figure 3] and [Figure 4].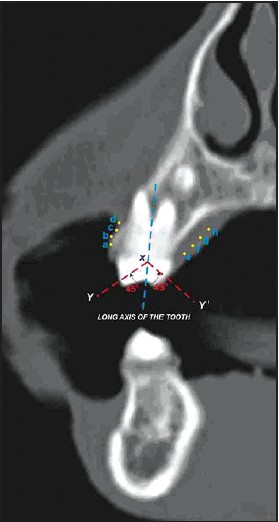 | Figure 3: Coronal section view in computed tomography with buccal and palatal points marked at different levels for soft-tissue thickness
Click here to view |
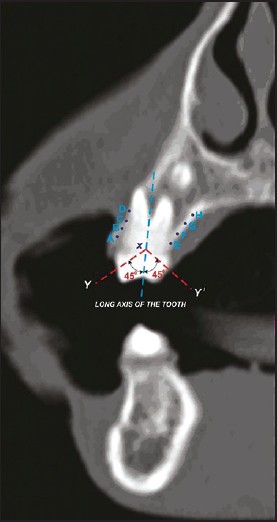 | Figure 4: Coronal section view in computed tomography with buccal and palatal points marked at different levels for cortical bone thickness
Click here to view |
Group I
The buccal soft-tissue and cortical bone thickness in bucco-palatal direction showed a gradual increase from coronal region (near alveolar crest) towards the apex (mean value at a-0.11 cm to d-0.19 cm and A-0.14 cm to D-0.18 cm). The greatest thickness was recorded at the apex than at the coronal region for both soft-tissue and cortical bone (mean value at d-0.19 cm and D-0.18 cm).The palatal soft-tissue thickness showed similar pattern as seen in buccal side from e to g and thereafter showed a constant value (mean value from e-0.28 cm to g-0.35 cm, at h-0.35 cm).Similarly, the palatal cortical bone thickness increases from E to G and thereafter showed a slight decrease at H (mean value from E-0.17 cm to G-0.19 cm, at H-0.18 cm).
Group II
The buccal soft-tissue and cortical bone thickness in bucco-palatal direction showed a similar pattern as seen in Group I, i.e., gradual increase from coronal region (near alveolar crest) toward the apex (mean value at a-0.09 cm to d-0.15 cm and A-0.14 cm to D-0.17 cm).The palatal soft-tissue showed a similar pattern as seen on buccal side, i.e., gradual increase from e to g and thereafter slightly decreasing at h (mean value from e-0.22 cm to g-0.34 cm, at h-0.33 cm).The palatal cortical bone thickness showed a constant value at E and F (mean value 0.16 cm) and thereafter slight decreasing and a constant value from G to H (mean value 0.15 cm).
Group III
The buccal soft-tissue thickness in bucco-palatal direction showed a gradual increase from coronal region (near alveolar crest) toward the apex (mean value at a-0.09 cm to d-0.16 cm). The cortical bone thickness showed a similar pattern as seen for soft-tissue from A to C (mean value at A-0.13 cm to C-0.15 cm) and thereafter no changes (mean value at D-0.15 cm). The greatest thickness was recorded at the apex than at the coronal region for both soft-tissue and cortical bone (mean value at d-0.16 cm and D-0.15 cm). The palatal soft-tissue thickness showed similar pattern as seen on buccal side from e to h, i.e., gradual increase from coronal region to apex (mean value from e-0.21 cm to h-0.47 cm). The palatal cortical bone thickness showed a gradual increase from E and F (mean value from E-0.15 cm to F-0.16 cm) and thereafter constant value from G to H (mean value 0.16 cm).
In all groups, soft-tissue thickness was greater on the palatal side than on buccal side and the palatal cortical bone thickness was greater in Group I and III except in Group II where buccal cortical bone was greater [Table 1], [Table 2] and [Graphs 1-8 [Additional file 1]].
| Discussion | | |
It was a turning point in the field of orthodontics with the introduction of extra dental intraoral anchorage device (mini-implants). It has tried to achieve skeletal or absolute anchorage, which made the treatment more efficient, and less costly than conventional implants.
Insertion of the mini-implant at an oblique angle allows for the use of more space, reduces the possibility of root injury and increases the surface area in contact with cortical bone. However, the problem with this was that screws placed in unattached gingiva can lead to soft-tissue complications because of the difficulties in maintaining proper oral hygiene. Placement in the attached or on the border between attached and unattached gingiva with thinner soft-tissue is therefore preferable. The main criterion for stability of an implant is the quality and quantity of cortical bone and thin soft-tissue.
In Group I, II and III, the soft-tissue was seen thicker on the palatal side than on buccal side (mean value-0.21-0.47 cm) and in Group I and II, the cortical bone on buccal side was thicker at point D (mean value-0.18 and 0.17 cm respectively toward the apical region) and the cortical bone on palatal side was thicker in Group I at G (mean value-0.19 cm from between middle and apical region) and in Group II at E to F (mean value-0.16 cm from coronal to middle region on palatal side). In Group III, buccal cortical bone was thicker at C and D (mean value-0.15 cm from middle to apical region) and at F to H (mean value-0.16 cm from the middle to apical region). In this study, it was found that in Group I, II, and III the soft-tissue and cortical bone thickness on buccal side gradually increased from the alveolar crest to the apex (a to d and A to D). Therefore on the buccal side the appropriate place for an implant would be at the attached or on the border between attached and unattached gingiva (between c and d and C and D), thereby avoiding sinus perforation and root injury. On the palatal side, it would be beneficial if the implant is placed obliquely and more toward coronal region as the soft-tissue thickness is less compared with the apical region. Although attached gingiva is considered as an important, it is wise to select a location where the attached gingival thickness is less and cortical bone thickness is more. Therefore, the results show that an average thickness of the cortical bone on the buccal side (0.14-0.15 cm) and on palatal side (0.16-0.17 cm) is available for mini-implant placement [Figure 5].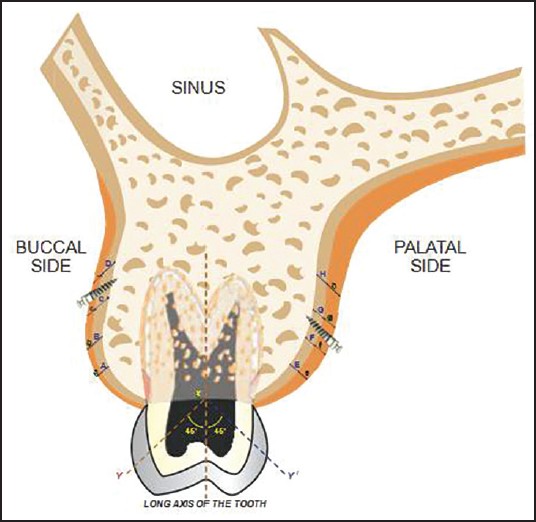 | Figure 5: Schematic representation-coronal section view of appropriate mini-implant placement site located in buccal and palatal region
Click here to view |
For the soft-tissue component, the risk of failure of mini-implant in the non-keratinized mucosa has been reported to be higher than that for mini-implant surrounded by keratinized mucosa. Therefore, in the buccal side of the alveolus, the mini-implant is usually placed in the interdental areas of the attached gingiva just adjacent to the mucogingival junction. In the palate, the whole area of the palatal masticatory mucosa is made up of the keratinized tissue in which the mini-implant can be reliably inserted. However, the palatal masticatory mucosa is known to be 2-3 times thicker than the attached gingiva on the buccal side, and different areas of the buccal attached gingiva have different soft-tissue thicknesses. Therefore, the soft-tissue in the areas for mini-implant insertion might be one of the important factors for successful implantation.
In previous studies done on cadavers using CT scan showed that best available location for a miniscrew is mesial or distal to the first molar and the best angulation is 30-60° from the long axis of the tooth. [7],[8],[9] Further studies are necessary to compare the accuracy of the measurements achieved in this study with a larger sample size. The use of other advanced imaging tools like magnetic resonance imaging etc., may be necessary for evaluating the soft-tissue structures, as these are not seen very clearly using CT. Furthermore, clinical studies to evaluate the quality of bone surrounding miniscrews may be necessary as only the bone quantity was assessed. Furthermore, mesiodistal measurements are essential for safe placement and stability of the miniscrew.
The challenge is for the clinician to decide on a particular imaging modality as a function of the information/diagnostic yield versus patient risk and cost benefit analysis. [10],[11],[12],[13],[14],[15]
| Conclusion | | |
Computed tomography has been a reliable tool to assess implant placement sites. It will also help in assessing and avoiding the sinus perforation, root injury, soft-tissue complication and utilizing appropriate cortical bone thickness. The overall goal of an orthodontist is to strive for improvements in the quality and efficiency in patient care. Hence in future, there will always be an overwhelming need to implement accurate and effective imaging modalities to improve the standard of diagnosis and treatment modalities.
| Acknowledgments | | |
We would like to sincerely thank Dr. Raghuraj M.B. for his expertise advice and valuable assistance in compiling and preparing the manuscript material.
| References | | |
| 1. | Burstone CJ. The segmented arch approach to space closure. Am J Orthod 1982;82:361-78. 
[PUBMED] |
| 2. | Brandão M, Pinho HS, Urias D. Clinical and quantitative assessment of headgear compliance: A pilot study. Am J Orthod Dentofacial Orthop 2006;129:239-44.
|
| 3. | Bondemark L, Kurol J, Bernhold M. Repelling magnets versus superelastic nickel-titanium coils in simultaneous distal movement of maxillary first and second molars. Angle Orthod 1994;64:189-98.
|
| 4. | Kim HJ, Yun HS, Park HD, Kim DH, Park YC. Soft-tissue and cortical-bone thickness at orthodontic implant sites. Am J Orthod Dentofacial Orthop 2006;130:177-82.
|
| 5. | Arun Kumar BR. Evaluation of soft tissue and cortical bone thickness at orthodontic implant sites using computed tomography. Dissertation submitted to Rajiv Gandhi University of Health Sciences; Bangalore, India, 2009.
|
| 6. | Henrot P, Blum A, Toussaint B, Troufleau P, Stines J, Roland J. Dynamic maneuvers in local staging of head and neck malignancies with current imaging techniques: Principles and clinical applications. Radiographics 2003;23:1201-13.
|
| 7. | Lee SJ, Kim JK, Park YC, Vanarsdall RL Jr. Applications of Orthodontic Mini-Implant. Hanover Park, IL: Quintessence Publishing Co, Inc.; 2007.
|
| 8. | Nanda R, Uribe FA. Temporary Anchorage Devices in Orthodontics. St. Louis, MO: Mosby Elsevier, Inc.; 2009.
|
| 9. | Sung JH, Kyung HM, Bae SM, Park HS, Kwon OW, McNamara JA Jr. Microimplants in Orthodontics. Daegu, Korea: Dentos, Inc.; 2006.
|
| 10. | Deguchi T, Nasu M, Murakami K, Yabuuchi T, Kamioka H, Takano-Yamamoto T. Quantitative evaluation of cortical bone thickness with computed tomographic scanning for orthodontic implants. Am J Orthod Dentofacial Orthop 2006;129:721.e7-12.
|
| 11. | Gahleitner A, Podesser B, Schick S, Watzek G, Imhof H. Dental CT and orthodontic implants: Imaging technique and assessment of available bone volume in the hard palate. Eur J Radiol 2004;51:257-62.
|
| 12. | Duckmanton NA, Austin BW, Lechner SK, Klineberg IJ. Imaging for predictable maxillary implants. Int J Prosthodont 1994;7:77-80.
|
| 13. | Ishii T, Nojima K, Nishii Y, Takaki T, Yamaguchi H. Evaluation of the implantation position of mini-screws for orthodontic treatment in the maxillary molar area by a micro CT. Bull Tokyo Dent Coll 2004;45:165-72.
|
| 14. | Gracco A, Lombardo L, Cozzani M, Siciliani G. Quantitative evaluation with CBCT of palatal bone thickness in growing patients. Prog Orthod 2006;7:164-74.
|
| 15. | Moon CH, Lee DG, Lee HS, Im JS, Baek SH. Factors associated with the success rate of orthodontic miniscrews placed in the upper and lower posterior buccal region. Angle Orthod 2008;78:101-6.
|
[Figure 1], [Figure 2], [Figure 3], [Figure 4], [Figure 5]
[Table 1], [Table 2]
|


 Search Pubmed for