|
 
 |
| ORIGINAL ARTICLE |
|
| Year : 2013 | Volume
: 8
| Issue : 3 | Page : 135-139 |
|
Structure and physical properties of flowering plants of the genus hibiscus
Nisreen Awad Eltahir1, Mohamed A. Siddig2, Abubaker A. Siddig3, Hajer Adam4
1 Departments of Physics, Faculty of Science and Technology, AL Neelain University, Elobied, Sudan
2 Departments of Physics, Faculty of Science and Technology, AL Neelain University, Elobied; Department of Medical Physics, National University, Khartoum, Sudan
3 Department of Physics and Astronomy, King Saud University, Riyadh, Saudi Arabia
4 Faculty of Education, Kordfan University, Elobied, Sudan
| Date of Web Publication | 16-May-2014 |
Correspondence Address:
Mohamed A. Siddig
Department of Physics, Faculty of Science and Technology, El Neelain University, Khartoum, Sudan
  | Check |
DOI: 10.4103/1858-5000.132597 
Introduction: Hibiscus is a genus of flowering plants in the mallow family, Malvacease. It is quite large, containing several hundred species that are native to warm-temperate and have many medical benefits, for example, hibiscus drink lowers high blood pressure. Materials and Methods: Flowering plants of hibiscus were used in this study. X-ray fluorescence (XRF) and Fourier Transformation infrared spectroscopy (FTIR) were used as analytical techniques. The XRF results indicated that, hibiscus has contained Potassium (K), Calcium (Ca), Iron (Fe), Copper (Cu), Bromine (Br), and Strontium (Sr). Results: The FTIR spectra of hibiscus showed a broad and strong absorption band in the range1145-2926 cm -1 , and these absorptions were assigned to the different stretching vibrations. The conductivity and dielectric properties of hibiscus were measured as function of frequency. The conductivity was found to decrease with frequency while the opposite behavior was observed in case of dielectric. In order to investigate the optical properties, solutions with different concentration of hibiscus were prepared. Ultraviolet-visible spectroscopy (UV) was used to obtain the absorption for different samples with different concentration. Conclusion: The absorption was found to increase with the increase of concentration of hibiscus. Keywords: Absorption, conductivity, hibiscus, spectroscopy, X-ray fluorescence
How to cite this article:
Eltahir NA, Siddig MA, Siddig AA, Adam H. Structure and physical properties of flowering plants of the genus hibiscus. Sudan Med Monit 2013;8:135-9 |
| Introduction | |  |
A greater knowledge of the physical properties of plants is important for future applications, as well as for improvements in product development of that is currently available. [1]
Hibiscus is a genus of flowering plants in the mallow family, Malvacease. It is quite large, containing several 100 species that are native to warm-temperate, subtropical and tropical regions throughout the world. The plant is grown in central and Western Sudan, Syria, Southern Iraq, Egypt and many other countries.
Some studies proved that, hibiscus have many medical benefits, [2],[3],[4],[5],[6] for example, hibiscus drink lowers high blood pressure and increases the speed of blood circulation, strengthens the heart and kills microbes, making it useful in the treatment of fever and microbial infections and cholera epidemics. Being acidic in water with its properties as a moisturizing tonic, it helps in food digestion. [2] Mozaffari-Khosravi et al. [3] study showed that, consuming hibiscus tea lowers blood pressure in a group of pre-hypertensive and mildly hypertensive adults. In 2008, the USA department of agriculture study has reported a lowering of blood pressure following the consumption of hibiscus tea in a group of pre-hypertensive and mildly hypertensive adults.
Their data support the idea that drinking hibiscus tea in an amount readily incorporated into the diet may play a role in controlling blood pressure. [4] Furthermore, as colored dye is used in chemical industries, cosmetics (Alkuzmtic) and in the food industry as a colorant in addition to its merits of being natural healthy and a general tonic.
In this work, dry Roselle flower was used. X-ray fluorescence (XRF) and Fourier transformation infrared spectroscopy (FTIR) were used as analytical techniques. The conductivity and dielectric properties of hibiscus were measured as a function of frequency. In order to investigate the optical properties of hibiscus solutions were prepared in different concentration and the absorption was then determined using ultraviolet-visible spectroscopy (UV-Vis).
| Materials and Methods | | |
0Sample preparation
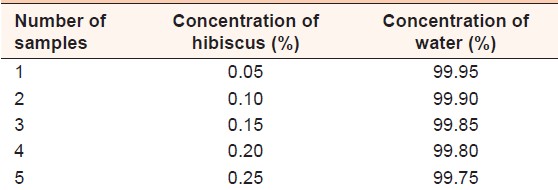
Roselle flower has been drying in the sun for 3 days and then powdered. In order to prepare a sample for FTIR, small amount of potassium bromide was added to Roselle powder and the powder was then compressed to make the thin shape that can be analyzed using FTIR device. 1 g of Roselle powder was prepared in the form of a capsule for analyzing using impedance spectroscopy (IS). The optical properties of hibiscus were studied using solution with different concentration [Table 1].
Equipment's and measurements
The XRF was performed using Cd-109 XRF spectrometer system, whereas the FTIR results were obtained using the instrument Satellite FTIR serial no. 20010102.
The IS results were obtained using Quad Tech (1920) LCR meter impedance analyzer.
The absorption of solution with different concentration was calculated using UV min 1240 spectrometer Shimadzy.
| Results and Discussion | | |
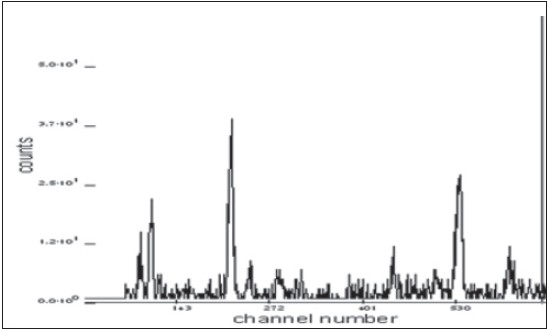
The fluorescent radiation can be analyzed either by sorting the energies of the photons (energy-dispersive analysis) or by separating the wavelengths of the radiation (wavelength-dispersive analysis). Once sorted, the intensity of each characteristic radiation is directly related to the amount of each element in the material. [7],[8],[9] This is the basis of a powerful technique in analytical chemistry. XRF data allows the researchers to observe the elements present in the sample. Each element that gives an XRF signal appears at a unique energy level and is characteristic of that element. The XRF was performed for hibiscus plant after being dried and powdered and powder. 1 g of the powder was used in XRF system. [Figure 1] shows the XRF spectra of hibiscus. The structural characterizations and the result obtained are shown in [Table 2]. XRF results indicated the presence of the following elements in hibiscus Potassium (K), Calcium (Ca), Iron (Fe), Copper (Cu), Bromine (Br) and Strontium (Sr). The table shows that calcium has the highest concentration while the least is copper.
An infrared spectrum represents a fingerprint of a sample with absorption peaks, which correspond to the frequencies of vibrations between the bonds of the atoms making up the material. Because each different material is a unique combination of atoms, no two compounds produce the exact same infrared spectrum. Therefore, infrared spectroscopy can result in a positive identification (qualitative analysis) of every different kind of material. In addition, the size of the peaks in the spectrum is a direct indication of the amount of material present. [9],[10]
The FTIR was performed on a powder sample of hibiscus. FTIR spectra are shown in [Figure 2] The analysis of FTIR spectra for the sample is presented in [Table 3]. The spectra of hibiscus showed a broad and strong absorption band in the range: 1145-2926 cm−1 . The C-C stretching vibration appears at 1145 cm−1 . The O-H bending vibration appears at 1405 cm−1 . The C = C stretching are present at 1629 cm−1 . The N-H bending vibrations are present at 2359 cm−1 . The symmetric vibration of H atom can be assigned to 2853 cm−1 and 2926 cm−1 . Akhtar and Podder used FTIR to characterize their samples and most of their observed stretching vibrations are similar to our results. [11],[12] These observations are in agreement with the XRF results.
In order to determine the conductivity, firstly, impedance was measured for the powder sample of hibiscus using IS and then the formula σ = t/ZA was used, [10],[13] where σ is conductivity, Z: Impedance, t: Thickness, and A: Surface area of the sample.
[Figure 3] shows the plot of the conductivity versus frequency. The conductivity was found to increase gradually with frequency. The dielectric, which is reciprocal of conductivity, is plotted versus frequency in [Figure 4]. The dielectric was found to decrease, as expected, with the increase of frequency.
The UV-Vis optical absorption spectra of five samples of hibiscus of different concentrations were determined. The effect of concentration on the optical absorption is shown in [Figure 5] and [Figure 6]. It is obvious from the figures, that the absorption increases with concentration of hibiscus. This observation can be explained by the increase of assembly of molecules when the concentration is increased. [Figure 7] shows the concentration versus the position of wavelength for the maximum peak of absorption of different samples. The position of the maximum peak was found to shift to a higher value with the increase of concentration. The absorptions of samples are positioned out of visible range. The concentration versus transmittance is shown in [Figure 8]. The transmittance is found to decrease with the increase in concentration. These results are in good agreement with the results of absorption. The effect of time on the absorption is shown in [Figure 9]. The absorption is found to decrease when the time is increased. The decrease in absorption with the time can be explained by that the molecules of sample absorbed light, since the samples were left in the laboratory. The optical transmission spectral analysis was performed.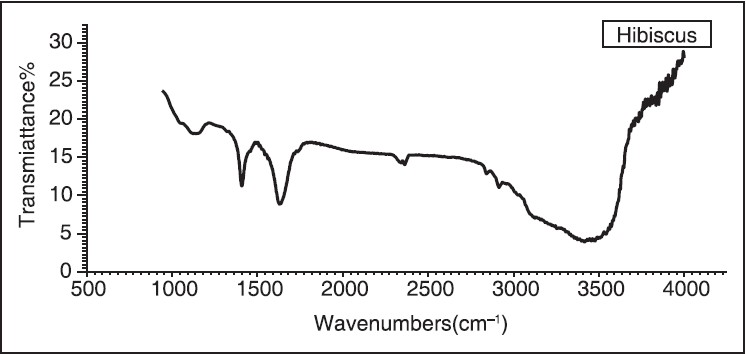 | Figure 2: Fourier transformation infrared spectroscopy spectra of the hibiscus
Click here to view |
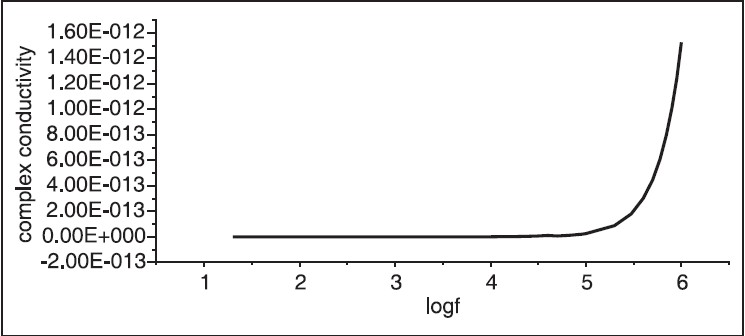 | Figure 3: The frequency versus complex conductivity. The conductivity of hibiscus was found to increase suddenly at frequency
Click here to view |
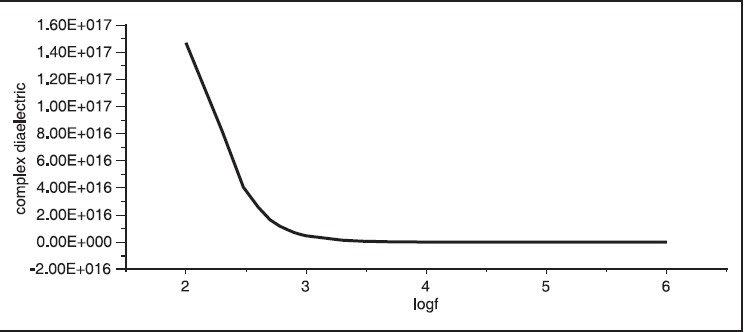 | Figure 4: Frequency versus complex dielectric, this fi gure showed the complex dielectric of hibiscus was decreased with increasing in the frequency
Click here to view |
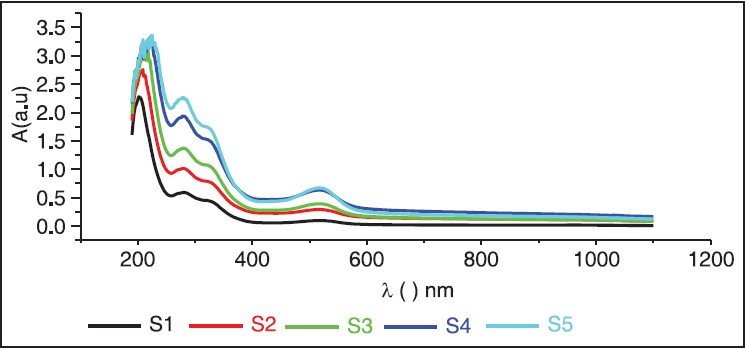 | Figure 5: Absorption versus wavelength for different samples with concentration
Click here to view |
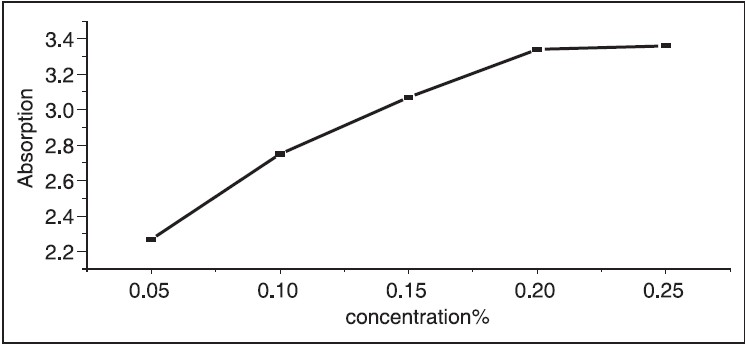 | Figure 6: Absorption versus concentration of five samples, the absorption of hibiscus is increased with increasing in the concentration
Click here to view |
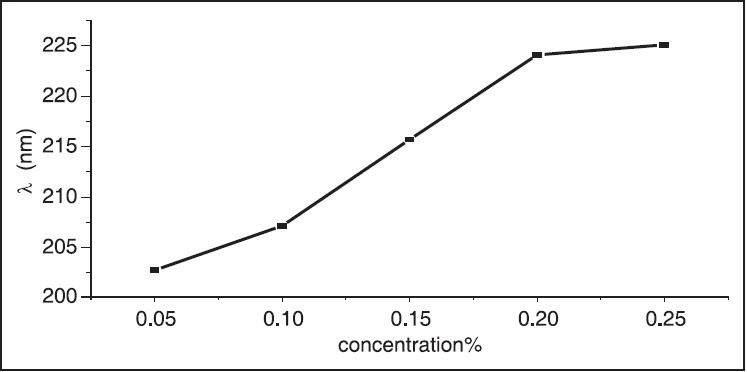 | Figure 7: Concentration versus wavelength, the wavelength shift to higher value with increase of concentration of hibiscus
Click here to view |
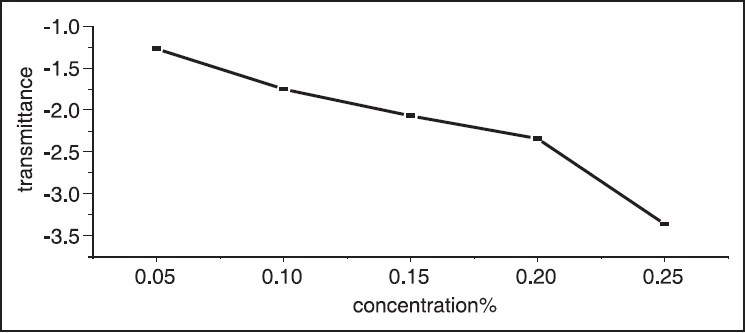 | Figure 8: Concentration versus transmittance, the transmittance is decreased with increase of concentration of hibiscus
Click here to view |
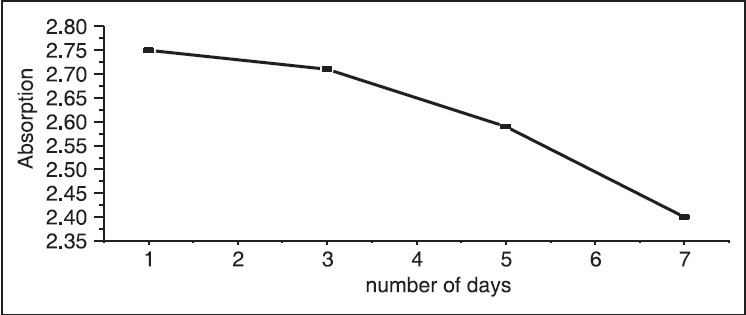 | Figure 9: Absorption versus number of days in sample 2, the absorption of hibiscus is decreased with the time
Click here to view |
The following parameters namely; absorption (A), transmittance (T), reflectance (R), refractive index (n), absorption co-efficient (α), extinction co-efficient (K), conductivity (σ) and dielectric (ε), were obtained and measured experimentally except for some that were calculated theoretically using different equations. [9] The results of the parameters for the samples with different concentration of hibiscus are summarized in [Table 4].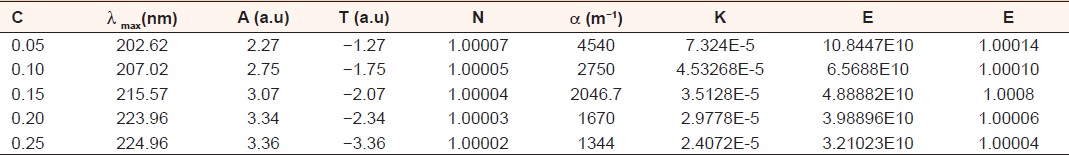 | Table 4: The results measured experimentally and that calculated theoretically for the absorption (A), transmittance (T), refl ectance (R), refractive index (n), absorption coeffi cient (á), extinction coeffi cient
(K), conductivity (ó) and dielectric (å)
Click here to view |
| Conclusions | | |
The flowering plants of hibiscus were used in our study. The XRF results indicated that, hibiscus has contained Potassium (K), Calcium (Ca), Iron (Fe), Copper (Cu), Bromine (Br) and Strontium (Sr). Concentration of calcium was the highest while the least was of copper The FTIR spectra of hibiscus showed broad and strong absorption band in the range: 1145-2926 cm−1 and these absorptions were assigned to the different stretching vibrations. The conductivity and dielectric of hibiscus were measured as a function of frequency and conductivity was found to decrease with frequency, whereas an opposite behavior was observed for dielectric. UV-Vis was used to determine the optical properties of solutions for different samples with different concentration. The absorption was found to increase with concentration. Furthermore, the effect of time showed that the absorption is decreased when time is increased.
| References | | |
| 1. | Siddig MA, Abidin SS, Radiman S, Muniandy SV. Properties and rheological behaviour of oil in water emulsions of glucopone surfactant. Malays J Phys 2004;25:73-6. 
|
| 2. | Qi Y, Chin KL, Malekian F, Berhane M, Gager J. Biological Characteristics, Nutritional and Medicinal Value of Roselle, Hibiscus Sabdariffa. SUAREC CIRCULAR - Urban Forestry Natural Resources and Environment No. 604 http://www.suagcenter.com/fact_sheets.html.
|
| 3. | Mozaffari-Khosravi H, Jalali-Khanabadi BA, Afkhami-Ardekani M, Fatehi F, Noori-Shadkam M. The effects of sour tea (Hibiscus sabdariffa) on hypertension in patients with type II diabetes. J Hum Hypertens 2009;23:48-54.
|
| 4. | Bliss RM. November 2008, study shows consuming hibiscus tea lowers blood pressure, United States Department of Agriculture, (http://www.ars.usda.gov/is/pr/2008/081110.htm).
|
| 5. | Shin YS. Medicinal Plants in Papua New Guinea, World Health Organization (WHO), Manila, Philippines, Library Cataloguing in Publication Data 2009, ISBN 978 92 9061 249 0.
|
| 6. | Mahdevan N, Kamboj P. Hibiscus sabdariffa linn: An overview. Nat Prod Radiance 2009;8:77-83.
|
| 7. | Beckhoff B, Kanngieber B, Langhoff N, Wedell R, Wolff H. 1965, Handbook of Practical X-Ray Fluorescence Analysis, Springer Berlin Heidelberg, New York.
|
| 8. | Pavia D, Iampman GM, Kriz GS (2001), Introduction to spectroscopy. Thomson learning, Belmont, CA.
|
| 9. | Ziman JM 1972, Principles of the theory of solids, Cambridge University Press, Cambridge New York.
|
| 10. | Magd AS. Spectroscopy Using Infrared. Cairo: Academy of the Modern University, Book; 2011.
|
| 11. | Akhtar F, Podder J. Structural, optical, electrical and thermal characterizations of pure and L-alanine doped ammonium dihydrogen phosphate crystals. Journal of Crystallization Process and Technology (JCPT) 2011;1:18-25.
|
| 12. | Khanum F, Podder J. Structural and optical properties of triglycine sulfate single crystals doped with potassium bromide. Journal of Crystallization Process and Technology (JCPT) 2011;1:26-31.
|
| 13. | Coates J. 2000, Interpretation of Infrared Spectra, A Practical Approach, pp. 10815-10837 John Wiley and Sons Ltd, Chichester, UK.
|
[Figure 1], [Figure 2], [Figure 3], [Figure 4], [Figure 5], [Figure 6], [Figure 7], [Figure 8], [Figure 9]
[Table 1], [Table 2], [Table 3], [Table 4]
|


 Search Pubmed for