|
 
 |
| ORIGINAL ARTICLE |
|
| Year : 2013 | Volume
: 8
| Issue : 4 | Page : 174-178 |
|
Electrical and optical properties of two types of Gum Arabic
Hajer Adam1, Mohamed A. Siddig2, Abubaker A. Siddig3, Nisreen Awad Eltahir4
1 Physics Department, Faculty of Education, Kordfan University, Elobied, Sudan
2 Physics Department, Faculty of Science and Technology, AL Neelain University; Department of Medical Physics, National University, Khartoum, Sudan
3 Department of Physics and Astronomy, King Saud University, Riyadh, Saudi Arabia
4 Physics Department, Faculty of Science and Technology, AL Neelain University, Khartoum, Sudan
| Date of Web Publication | 22-May-2014 |
Correspondence Address:
Mohamed A. Siddig
Department of Physics, Faculty of Science and Technology, El Neelain University, Khartoum Sudan
  | Check |
DOI: 10.4103/1858-5000.133006 
Introduction: Gum Arabic is most important commercial poly-saccharine and it is probably the oldest food hydro-colloid in current use. Gum Arabic is naturally obtained from Acacia Senegal and seyal trees which are known to grow in sub Sahara region of the Sudan. Materials and Methods: Two types of Gum Arabic namely; Acacia Senegal and Seyal were used. X-ray fluorescence (XRF) and Fourier Transformation infrared spectroscopy (FTIR) were used as analytical techniques. The conductivity and dielectric of both types of Gum Arabic were measured as function of frequency. Solutions with different concentration of Gum Arabic for both types were prepared and the Ultraviolet-visible spectroscopy (UV) was used to study the optical properties of these solutions. Results: The XRF results indicated that, Gum Arabic (Acacia Senegal and Seyal) contained Calcium (Ca), Iron (Fe), Copper (Cu), Lead (Pb), and Strontium (Sr). The FTIR spectra of both types of Gum Arabic showed broad and strong absorption band in the range of 600 to 3000 cm -1 . These absorptions were assigned to the different stretching vibrations. Conclusion: The conductivity was found to increase with frequency while the opposite behavior observed for the dielectric. The absorption was found to increase with the increase of concentration. Keywords: Absorption, conductivity, dielectric, Gum Arabic, optical properties
How to cite this article:
Adam H, Siddig MA, Siddig AA, Eltahir NA. Electrical and optical properties of two types of Gum Arabic. Sudan Med Monit 2013;8:174-8 |
| Introduction | |  |
Gum Arabic (GA) is most important commercial poly- saccharine and it is probably the oldest food hydro-colloid in current use. GA is naturally obtained from Acacia Senegal and seyal trees, which are known to grow in the sub-Sahara region of the Sudan. [1],[2] GA is the dried, gummy exudation obtained from various species of Acacia trees of the Leguminosae family. About 500 species of Acacia are distributed over tropical areas of Africa, India, Australia, Central America and south west North America. The composition of GA is dependent to some extend on the location and age of the tree. [3],[4]
Even though there are over 1,100 Acacia species world-wide, A. senegal and A. syal remain the most commercially exploited species. [5] GA is high molecular weight polymeric compounds, composed mainly of carbon core mixed in heterogeneous manner, including some materials in tonic forms as salts of macromolecules. [6],[7],[8]
There are many studies carried out using GA, but most of them were focused on food, hydrocolloid and adhesive material. In this study, we will examine the structure and physical properties such as electrical and optical properties for two types of GA.
| Materials and Methods | | |
Gum samples were collected during 2008 season as natural exudates nodules of A. senegal trees from Awlad Bakheit west Kordofan. The soil in this location is sand. The gum was dried at room temperature and kept in plastic containers for analysis. The A. seyal trees from Bram west Darfor were collected during 2010 season. The soil in this location is a clay soil.
To prepare a sample for Fourier transformation infrared spectroscopy (FTIR), we add a small amount of potassium bromide powder is compressed to a thin layer, which can be analyzed. The prepared sample is then placed in the device.
To prepare a sample of impedance spectroscopy (IS) press 1 g of GA in the form of a capsule. [Table 1] shows the five different concentrations of solutions prepared for ultraviolet (UV) measurements.
| Equipments and Measurements | | |
The X-ray fluorescence (XRF) were performed using Cd-109 XRF spectrometer system, while the FTIR results were obtained using the instrument of type Satellite FTIR serial no 20010102.
The IS results were performed using Quad Tech (1920) LCR meter impedance analyzer.
The absorption of the solution with different concentration was calculated using UV min 1240 spectrometer Shimadzy.
| Results and Discussions | | |
XRF data allows researchers to observe the elements present in the sample. Each element that gives an XRF signal appears at a unique energy level and is characteristic of that element. [9],[10],[11]
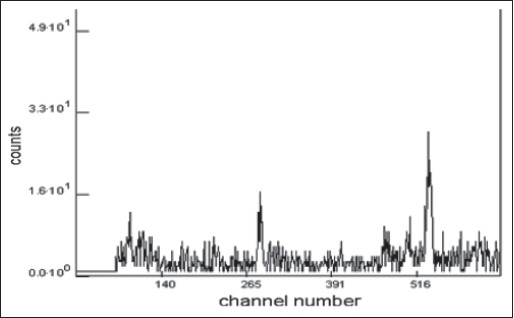
The XRF is performed for GA sample after being dried and prepared as powder. 1 g of the powder was used in XRF system. [Figure 1] shows the XRF spectra for GA (A. senegal) while [Figure 2] shows the XRF spectra for GA (A. seyal). The structural characterizations and the result obtained by XRF are shown in [Table 2] and [Table 3]. XRF results indicated that the GA contained Calcium (Ca), Iron (Fe), Copper (Cu) lead (Pb) and Strontium (Sr). It can be observed from these tables that calcium has the highest concentration while the least is lead.
An infrared spectrum represents a fingerprint of a sample with absorption peaks, which correspond to the frequencies of vibrations between the bonds of the atoms making up the material. Because each different material is a unique combination of atoms, no two compounds produce the exact same infrared spectrum. Therefore, infrared spectroscopy can result in a positive identification (qualitative analysis) of every different kind of material. In addition, the size of the peaks in the spectrum is a direct indication of the amount of material present. [12]
The FTIR was performed on powdered samples of two types of GA. The FTIR spectra are shown in [Figure 3] and [Figure 4]. The A. senegal and A. seyal illustrate broad and strong absorption band in the range 600-3000 cm -1 and these absorptions were assigned to the different stretching vibrations. Podder et al. used FTIR to characterize their samples and most of their observed stretching vibration are similar to our results. [13],[14] Their observation are in agreement with the XRF results.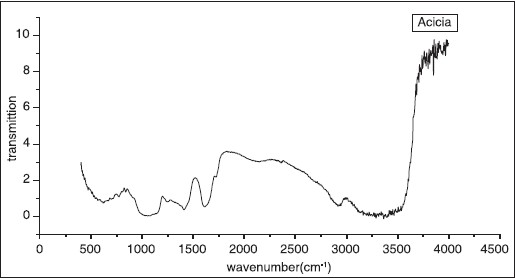 | Figure 3: Fourier transformation infrared spectroscopy spectra of the Gum Arabic (Acacia senegal)
Click here to view |
 | Figure 4: Fourier transformation infrared spectroscopy spectra of the Gum Arabic (Acacia seyal)
Click here to view |
IS was used to measure impedance. In order to determine the conductivity, impedance was firstly measured for the powder sample of GA for both types of GA using IS and then the formula σ = t/ZA was used. [12],[15] [Figure 5] shows the conductivity versus frequency for A. seyal sample. The conductivity was found to increase gradually with frequency. The dielectric, which is reciprocal of conductivity, was found to decrease, as expected, with the increase of frequency [Figure 6]. Similar results of conductivity and dielectric were found for a sample of GA (A. senegal ).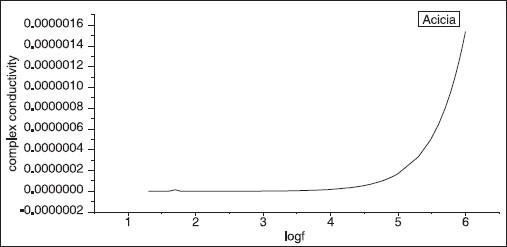 | Figure 5: Log frequency versus complex conductivity. The conductivity of GA (Acacia) increased with frequency
Click here to view |
The UV-visible optical absorption spectra of five samples of Acacica seyal and Senegal respectively at different concentrations were determined. [Figure 7] shows the absorption of A. seyal samples with concentration of 0.01, 0.2, 0.4, 0.6 and 0.8 respectively. [Figure 8] shows the effect of concentration on the optical absorptions of the samples. The concentration versus the position of wavelength for the maximum peak of absorption of different samples is shown in [Figure 9]. The position of maximum peak was found to shift to higher value with the increase of concentration. The absorptions of samples are positioned out of visible range. It is obvious that the absorption increases with the concentration of A. seyal and this can be explained by the increased of assembly of molecules when the concentration is increased. | Figure 6: Log frequency versus complex dielectric. The complex dielectric of GA (Acacia) decreased with frequency
Click here to view |
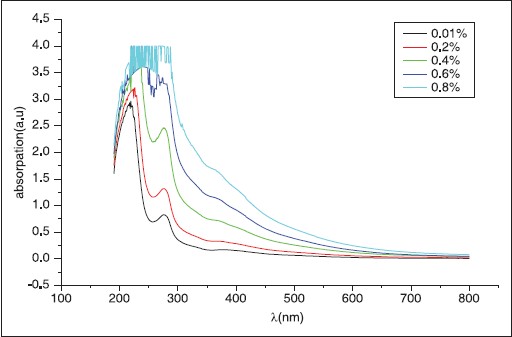 | Figure 7: Absorption versus wavelength for different samples with concentration
Click here to view |
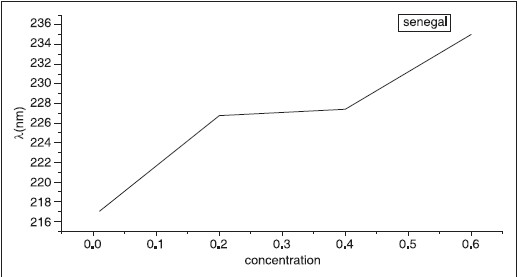 | Figure 8: Concentration versus wavelength. The wavelength shift to higher value with the increase of different concentration of GA (Senegal)
Click here to view |
 | Figure 9: The concentration versus absorption. The absorption shift to higher value with the increase of concentration of GA (senegal)
Click here to view |
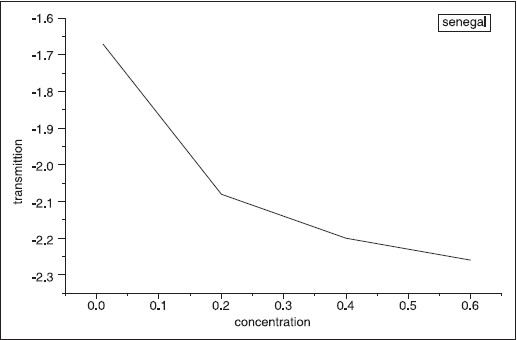 | Figure 10: The concentration versus transmittion. The transmittion shift to higher value with the increase of concentration of Gum Arabic
(senegal)
Click here to view |
The optical transmission spectral analysis was carried out. [Figure 10] shows transmittance versus the different concentration of and was found to decrease with concentration. These results are in good agreement with the results of absorption. After absorption of GA was measured, many parameters could be calculated using equations. These parameters include transmittance, refractive index, absorption coefficient and extinction coefficient. The results are shown in [Table 4] and [Table 5] for the two types of A. senegal and A. seyal, respectively. | Table 4: The result of Acacia seyal measured experimentally and that calculated theoretically for the
absorption (A), transmittance (T), refl ectance (R), refractive index (n), absorption coeffi cient (á) and
extinction coeffi cient (K)
Click here to view |
 | Table 5: The result of Acacia Senegal measured experimentally and that calculated theoretically for the
absorption (A), transmittance (T), refl ectance (R), refractive index (n), absorption coeffi cient (á) and
extinction coeffi cient (K)
Click here to view |
| Conclusion | | |
The XRF results for the two different types of the GA indicated the following elemental composition for GA (A. Senegal and A. seyal): Calcium (Ca), Iron (Fe), Copper (Cu), Lead (Pb), and Strontium (Sr). The concentration of calcium was the highest while the least was of lead. The FTIR spectra for GA (A. Senegal and A. seyal) showed a broad and strong absorption band in the range 600-3000 cm -1 and these absorptions were assigned to the different stretching vibrations. The conductivity of GA (A. senegal and seyal) was measured and found to increase with frequency while the opposite behavior was observed for dielectric. The absorption of solutions with different the concentration was found to increase with concentration for samples for both types of Guma Arabic.
| References | | |
| 1. | Ballal ME, El Siddig EA, Elfadl MA, Luukkanen O. Gum arabic yield in differently managed Acacia senegal stands in western Sudan. Agroforestry Forum 2005;63:237-45. 
|
| 2. | Glu EI. Rheological behaviour of whey protein stabilized emulsions in the presence of gum Arabic. J Food Eng 2002;52:273-7.
|
| 3. | Aminah Abdullah, Khalid Hamid Musa, proc.on International Gum Arabic Forum, Khartoum, Friendship Hall (2011) 10.
|
| 4. | Tahir AA, Elkheir MK, Yagoub AE. Effect of tree and nodule age on some physicochemical properties of gum from Acacia senegal (L.) Wild., Sudan. Res J Agric Biol Sci 2007;3:866-70.
|
| 5. | Dr. Abubakar Abdullahi, Director-General, RMRDC, Gum Arabic, October, 2004, Report On Survey Of Selected Agricultural Raw Materials In Nigeria, Kano, Nigeria.
|
| 6. | Al-Assaf S, Phillipsa GO, Williams PA. Controlling the molecular structure of food hydrocolloids. Food Hydrocoll 2006;20:369-77.
|
| 7. | Osman ME, Menzies AR, Williams PA, Phillips G, Baldwin TC. The molecular characterisation of the polysaccharide gum from Acacia senegal. Carbohydr Res 1993;246:303-18.
|
| 8. | Renard D, Lavenant-Gourgeon L, Ralet MC, Sanchez C. Acacia senegal gum: Continuum of molecular species differing by their protein to sugar ratio, molecular weight, and charges. Biomacromolecules 2006;7:2637-49.
|
| 9. | B. Beckhoff, B. Kanngießer, N. Langhoff, R. Wedell, H. Wolff, 1965, Handbook of Practical X-Ray Fluorescence Analysis, Springer Berlin Heidelberg, New York.
|
| 10. | Pavia D, Iampman GM, Kriz GS. Introduction to Spectroscopy. Thomson: Thomson Learning, Inc. ; 2001.
|
| 11. | J. M. Ziman, 1972, Principles of the theory of solids, Cambridge University Press, Cambridge New York.
|
| 12. | John Coates, 2000, Interpretation of Infrared Spectra, A Practical Approach, pp. 10815-10837 John Wiley and Sons Ltd, Chichester, UK.
|
| 13. | Akhtar F, Podder J. Structural, optical, electrical and thermal characterizations of pure and L-alanine doped ammonium dihydrogen phosphate crystals. Journal of Crystallization Process and Technology (JCPT) 2011;1:18-25.
|
| 14. | Khanum F, Podder J. Structural and optical properties of triglycine sulfate single crystals doped with potassium bromide. Journal of Crystallization Process and Technology (JCPT) 2011;1:26-31.
|
| 15. | Magd AS. Spectroscopy using Infrared. Cairo: Academy of the Modern University, Book; 2011.
|
[Figure 1], [Figure 2], [Figure 3], [Figure 4], [Figure 5], [Figure 6], [Figure 7], [Figure 8], [Figure 9], [Figure 10]
[Table 1], [Table 2], [Table 3], [Table 4], [Table 5]
|


 Search Pubmed for