
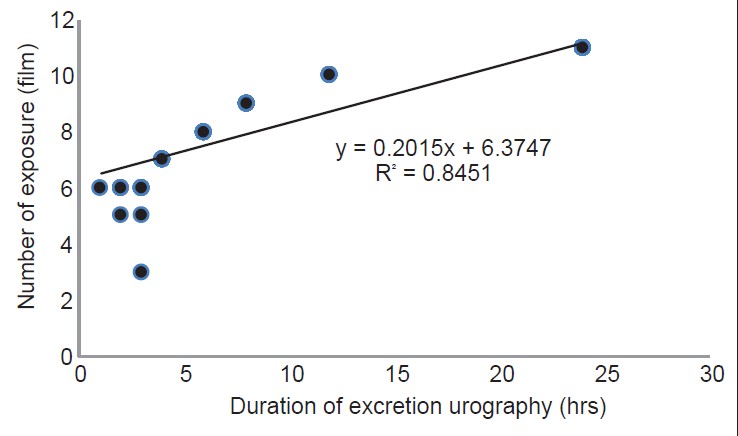
Figure 2: Scatter plot show a direct linear relationship between the number of exposure and duration of excretion urography
| Close | |
|
|
|
|
Figure 2: Scatter plot show a direct linear relationship between the number of exposure and duration of excretion urography
|
|