- Institution: Stanford Univ Med Ctr Lane Med Lib/Periodical Dept/Rm L109
- Sign In as Member / Individual
Serotonin 5-HT2 Receptors: Molecular and Genomic Diversity
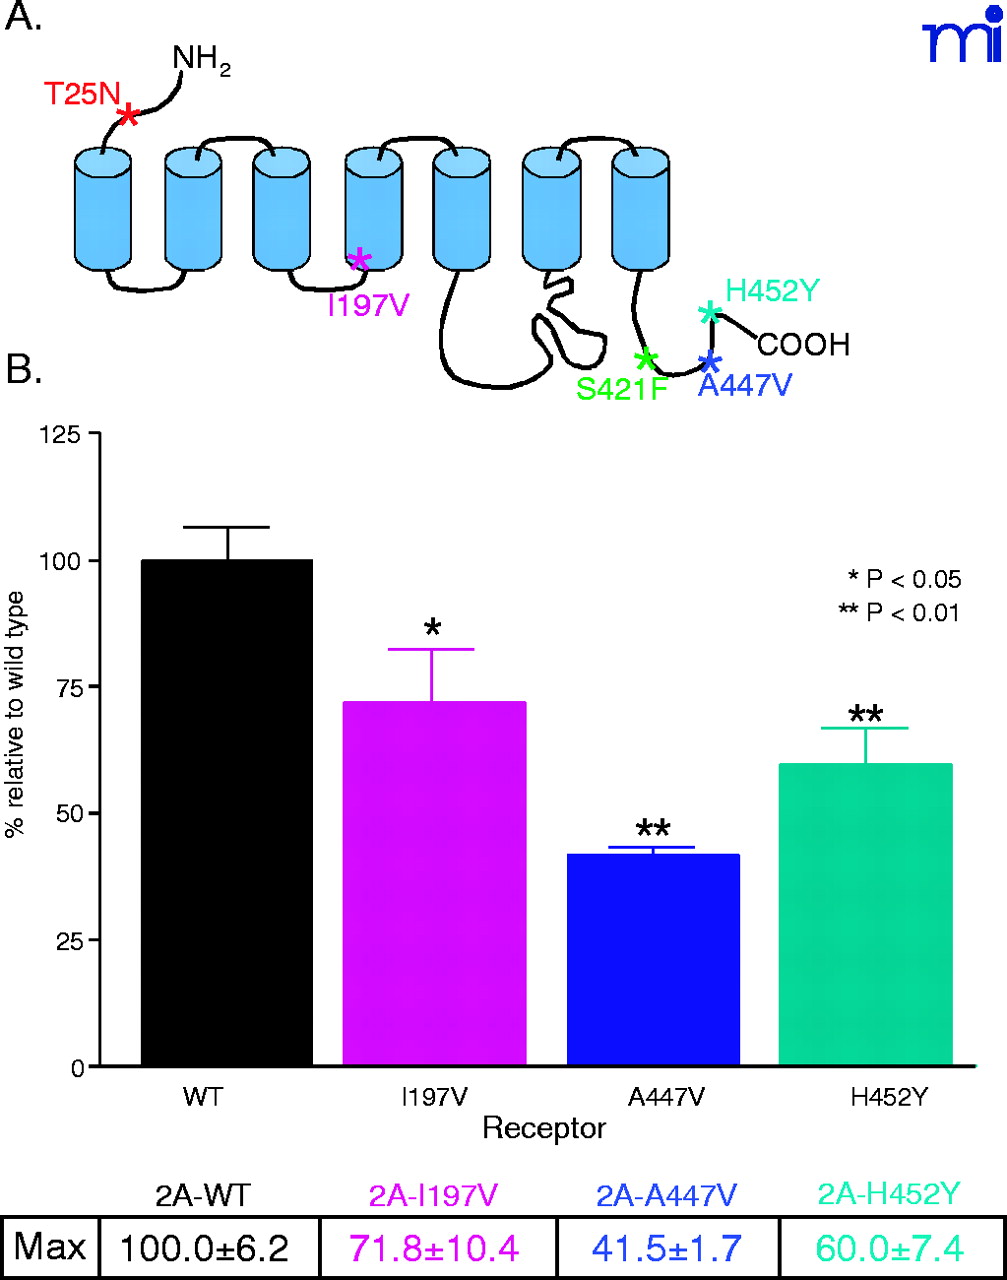
Figure 4.
Non-synonymous 5-HT2A R SNPs. A. Distribution of SNPs in the 5-HT2AR. Asterisks indicate sites of amino acid changes. B. Maximum PI hydrolysis response of NIH3T3 cells stably expressing 5-HT2AR variants; cells were treated with varying concentrations of 5-HT for 30 minutes to generate full dose-response curves. Data represent the maximum response obtained following drug treatment (n=5).

