- Institution: Stanford Univ Med Ctr Lane Med Lib/Periodical Dept/Rm L109
- Sign In as Member / Individual
Serotonin Transporter: Gene, Genetic Disorders, and Pharmacogenetics
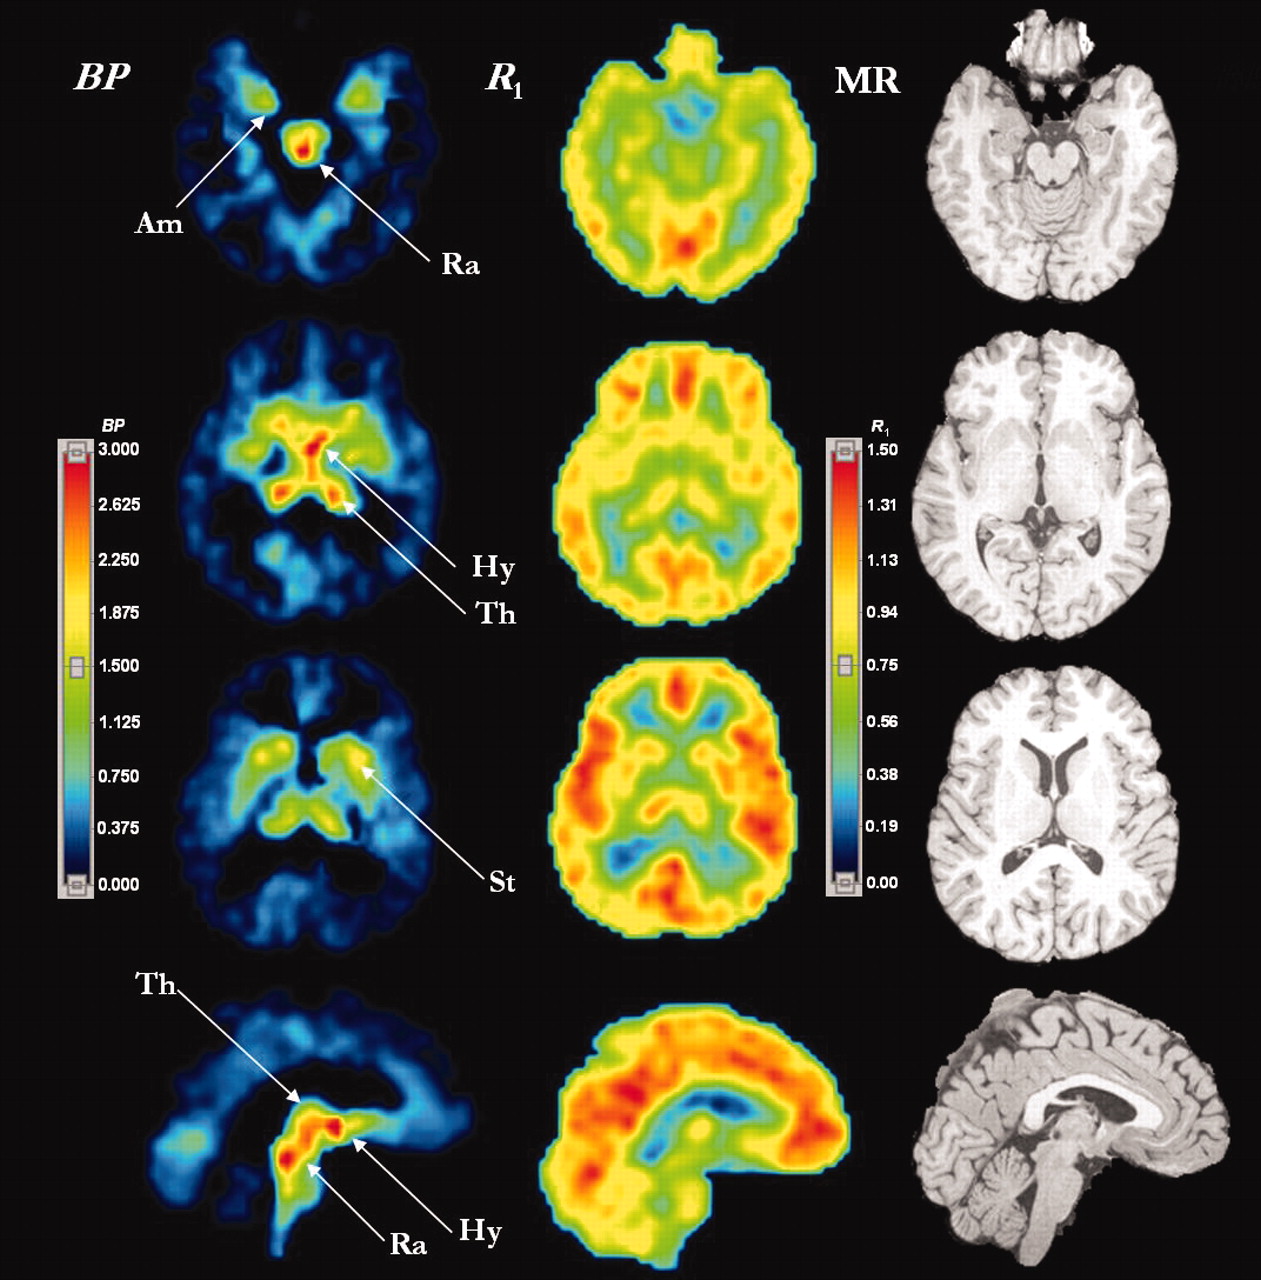
Using imaging techniques to identify the location of SERT. Positron emission tomography of SERT, showing parametric images of [11C]-DASB binding potential (BP) (left column) and relative delivery (R1) (middle column) estimated by the two-parameter multilinear reference tissue model, MRTM2. MRTM2 is a data analysis method that allows “volume pixel” (i.e., “voxel”)-wise mapping of SERT density (BP) and relative blood flow (R1) from dynamic [11C]-DASB PET data. (Voxelization is a process whereby the addition of depth to an image is gained by using a set of cross-sectional images.) Magnetic resonance (MR) images (right column) are shown for comparison. Upper rows are transverse images and the bottom row presents sagittal images. The color display ranges for BP images are 0 to 3.0 and for R1 images are 0 to 1.50 with higher numbers indicating greater SERT density (BP) or greater relative blood flow (R1) reveal where SERT may be more highly concentrated in brain areas. Am, amygdala; Hy, hypothalamus; Ra, raphe complex; St, striatum; and Th, thalamus. This figure was kindly provided by Drs. M. Ichise and R. Innis (64).

