- Institution: Stanford Univ Med Ctr Lane Med Lib/Periodical Dept/Rm L109
- Sign In as Member / Individual
LIPID Arrays: New Tools in the Understanding of Membrane Dynamics and Lipid Signaling
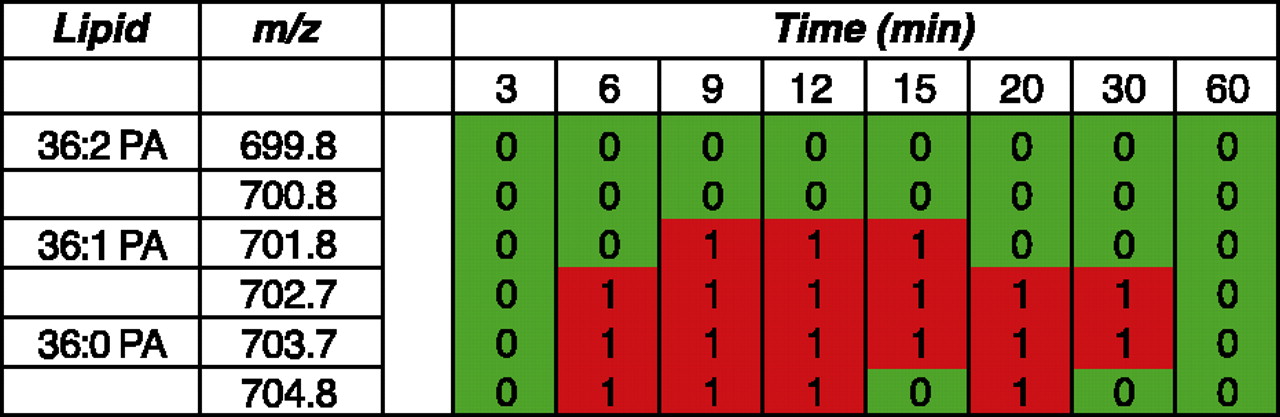
Figure 4.
Excerpt of a lipid array displaying peaks in them/z range of 699.8 to 704.8 at 8 time points. Analysis using CID MS/MS determined that this area contains phosphatidic acid (PA) species with 36 carbons and three different double-bond configurations. Two of the species are increasing in intensity at several of the time points between 6 and 30 minutes following stimulation of B6A4C1 mast cells with the calcium ionophore A23187.

