- Institution: Stanford Univ Med Ctr Lane Med Lib/Periodical Dept/Rm L109
- Sign In as Member / Individual
LIPID Arrays: New Tools in the Understanding of Membrane Dynamics and Lipid Signaling
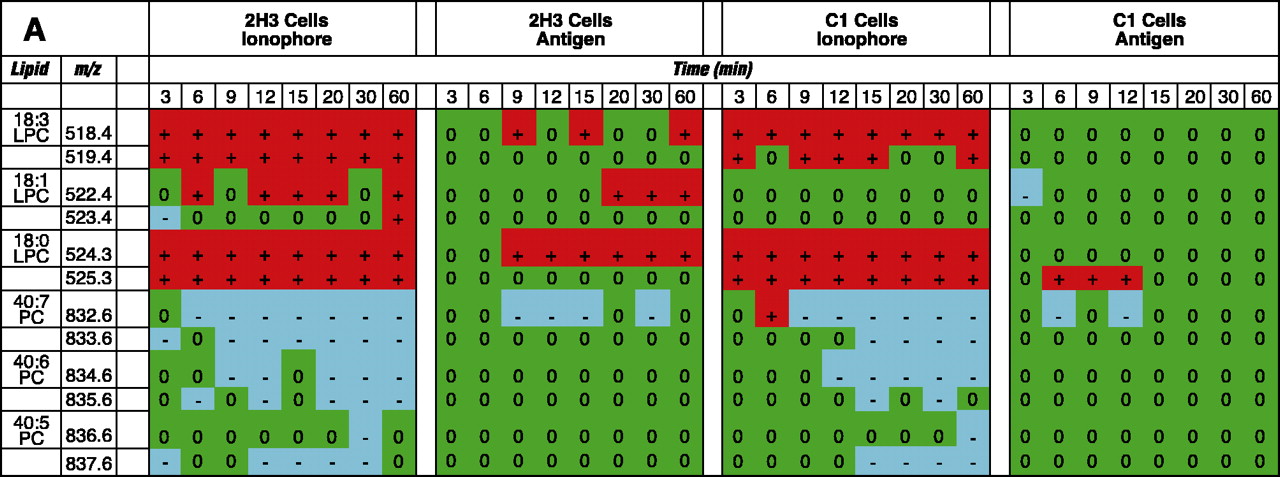
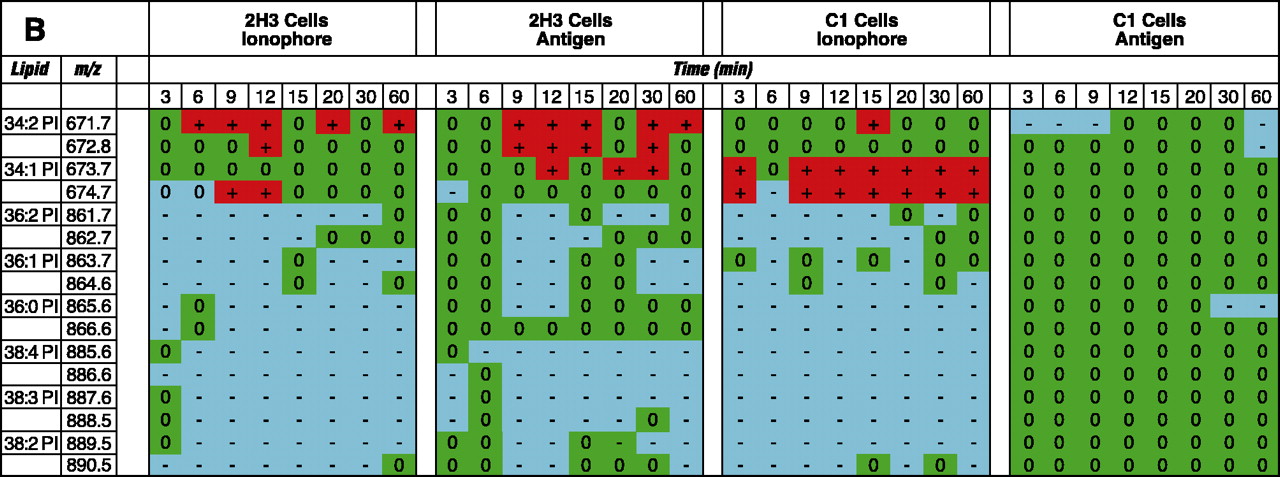
Lipidomics multiplexed analysis. Changes in individual molecular species of membrane phospholipids are shown from 2x10⁵ cell equivalents of lipid extract from RBL-2H3 and mutant RBL mastocytoma cells (B6A4C1) for comparison. Phospholipids were extracted using the Bligh/Dyer extraction procedure under acidic conditions (46). The chloroform phase of the extraction, containing most of the phospholipids, was carefully removed and the solvent was evaporated. The resulting lipid film was immediately dissolved in CH3OH:CHCl3 (9:1), containing 1% NH4OH to facilitate protonation, and analyzed by mass spectrometry. Mass spectra were acquired on a Bruker Esquire-LC 00146 ion trap mass spectrometer (Bruker Daltonics, Billerica, MA) equipped with an ESI interface. All samples were sprayed in positive and negative mode, resulting in a variety of molecular ion signals in the range of m/z 500–1000. Excerpts from the generated positive (A) and negative (B) mode lipid arrays are illustrated. Phospholipids are presented with the class abbreviation preceded by xx:y, where xx is the total carbon atoms in the fatty acid chains and y is the number of double bonds. (See text for details.)

