- Institution: Stanford Univ Med Ctr Lane Med Lib/Periodical Dept/Rm L109
- Sign In as Member / Individual
Comparing Solid Tumors with Cell Lines: Implications for Identifying Drug Resistance Genes in Cancer
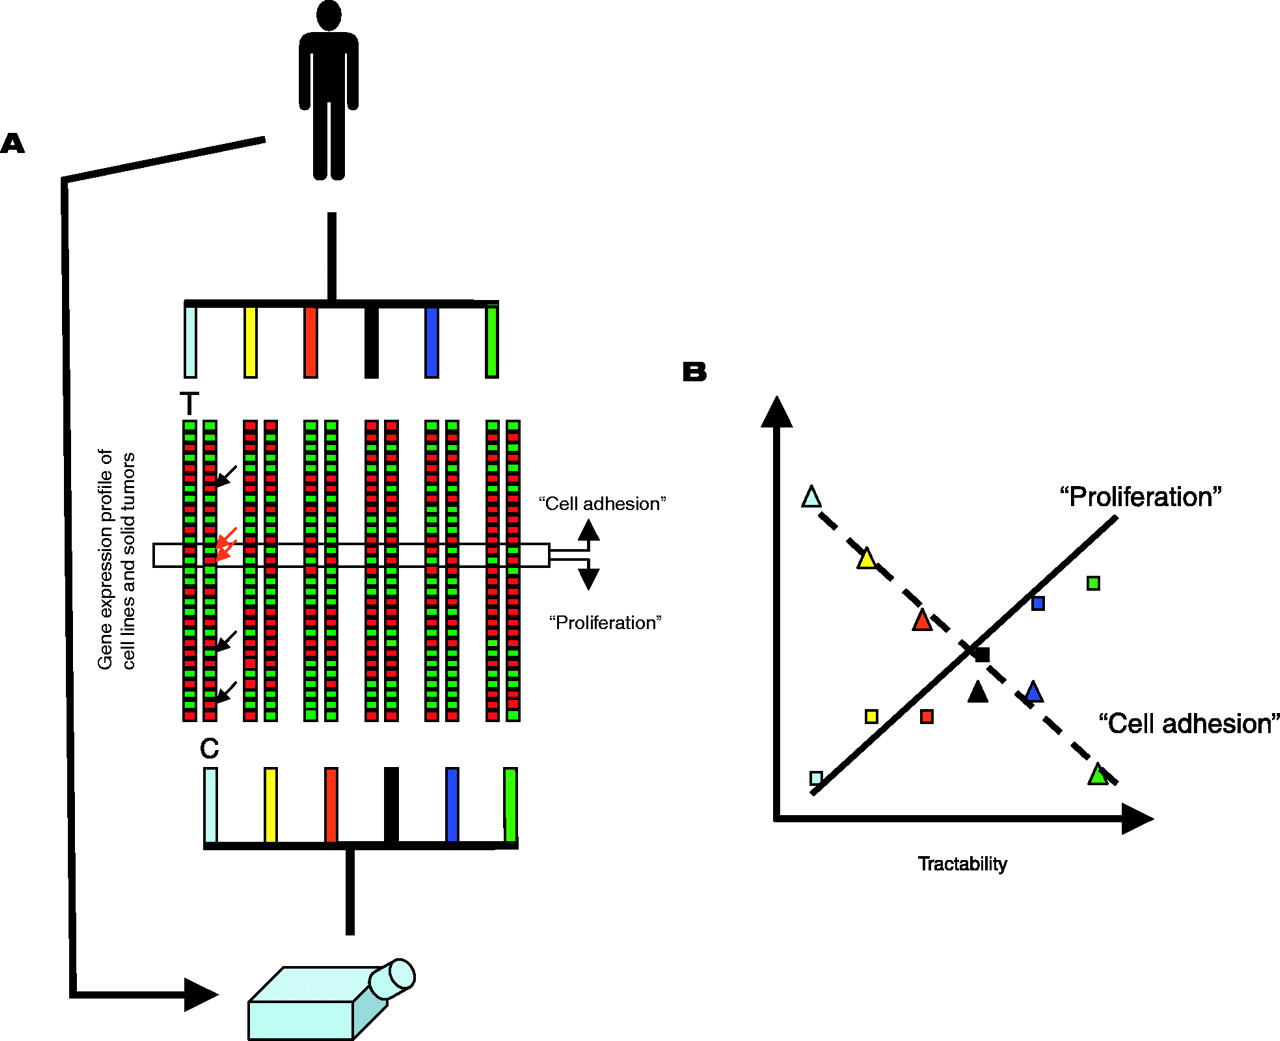
Cell lines and solid tumors may have different patterns of chemosensitivity and gene expression. A. Solid tumors are adherent and inert as compared to their derivatives kept in tissue culture flasks. Gene expression patterns (red and green spots) of tumor samples (T) and cell lines (C) indicate that tumor specimens obtained from biopsies, as well as cancer cell lines maintained in tissue flasks, retain signatures associated with their tissue of origin (illustrated here by schematic dendrograms that cluster tumors according to the tissue of origin, indicated by various colors). A tissue-by-tissue comparison of gene expression patterns between cell lines and solid tumors identifies differently expressed genes in each tumor type [arrows point to genes differently expressed in the first pair-wise comparison with samples obtained from tumor specimens (T) or cell lines (C)]. The expression of a set of genes (highlighted with an open horizontal rectangle) shows consistent differences throughout the tissue types (red arrows point to such genes in the first set of samples). These genes, whose expression is consistently altered as a result of the transition from in vivo to in vitro environments, belong to two major pathways (“Proliferation” and “Cell Adhesion”). Genes belonging to the “Proliferation” pathway are consistently overexpressed in cell lines, whereas the “Cell Adhesion” pathway is downregulated as a result of the adaptation of the cells to the in vitro environment. B. Genes that are differentially expressed in solid tumors and their derivative cell lines show correlation to the tractability of the tumor types. Tissues are known to give rise to cancers with variable response to therapy (axis of tractability). Genes of the “Proliferation” pathway are increasingly overexpressed in more tractable tumor types (expression levels are shown by colored squares, the correlation is indicated by a solid line). Genes of the “Cell Adhesion” pathway are increasingly overexpressed in less tractable tumor types (expression levels are shown by colored triangles, the correlation is indicated by a dashed line). Various colors represent tumor types.

