- Institution: Stanford Univ Med Ctr Lane Med Lib/Periodical Dept/Rm L109
- Sign In as Member / Individual
From Bioinformatics to Bioassays: Gleaning Insights into Protein Structure-Function from Disease-Associated nsSNPs
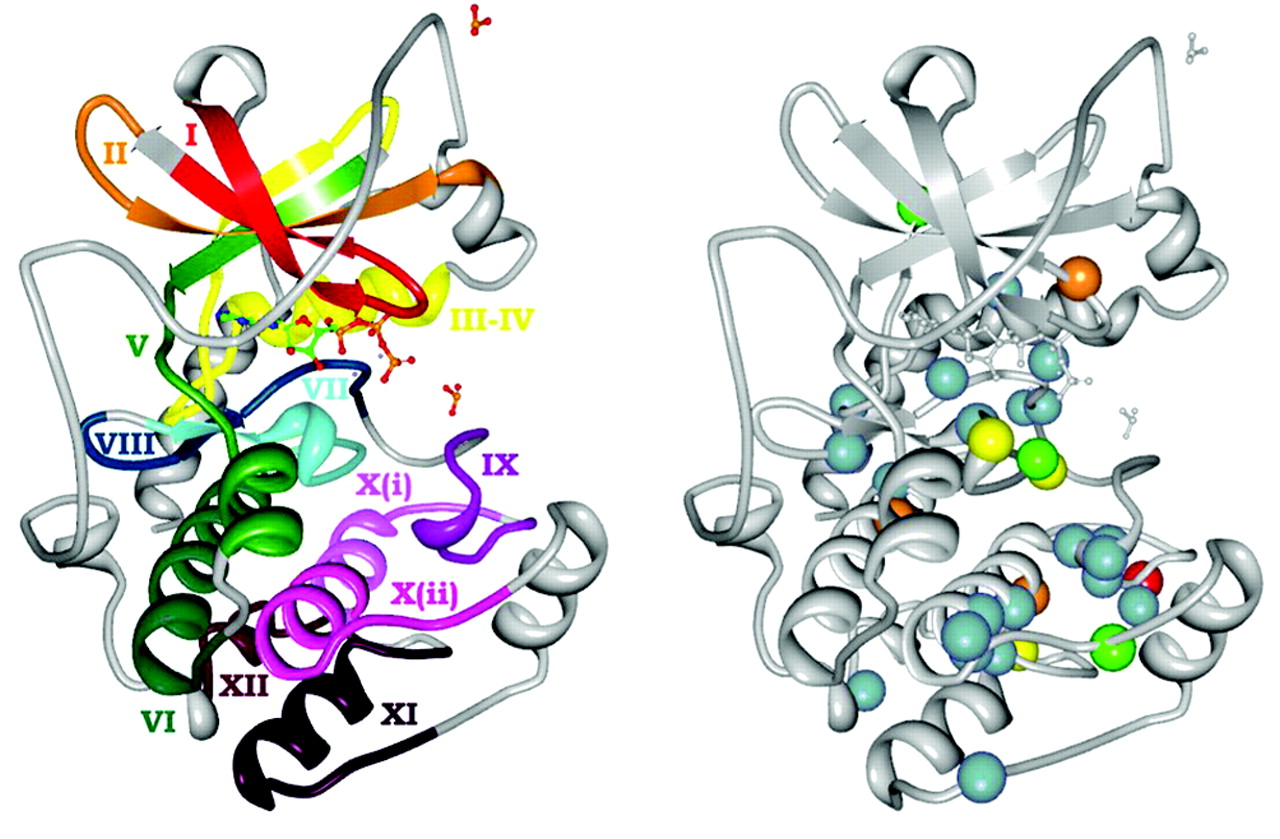
Figure 1.
Kinase subdomains and SNP distribution. A. The subdomains PKA (PDB entry 1ATP). Gray residues are intervening loops. Subdomains are numbered by roman numerals and color coded. B. The distribution of kinase disease SNPs. Spheres denote residues with high disease SNP frequencies; red, eight SNPs; yellow, seven SNPs; orange, six SNPs; green, five SNPs; and blue, four SNPs. Reprinted with permission (4).

