Mechanical Strength and Viscoelastic Response of the Periodontal Ligament in Relation to Structure
- Koichiro Komatsu komatsu-k{at}tsurumi-u.ac.jp1
Abstract
The mechanical strength of the periodontal ligament (PDL) was first measured as force required to extract a tooth from its socket using human specimens. Thereafter, tooth-PDL-bone preparations have extensively been used for measurement of the mechanical response of the PDL. In vitro treatments of such specimens with specific enzymes allowed one to investigate into the roles of the structural components in the mechanical support of the PDL. The viscoelastic responses of the PDL may be examined by analysis of the stress-relaxation. Video polarised microscopy suggested that the collagen molecules and fibrils in the stretched fibre bundles progressively align along the deformation direction during the relaxation. The stress-relaxation process of the PDL can be well expressed by a function with three exponential decay terms. Analysis after in vitro digestion of the collagen fibres by collagenase revealed that the collagen fibre components may play an important role in the long-term relaxation component of the stress-relaxation process of the PDL. The dynamic measurements of the viscoelastic properties of the PDL have recently suggested that the PDL can absorb more energy in compression than in shear and tension. These viscoelastic mechanisms of the PDL tissue could reduce the risk of injury to the PDL.
1. Introduction
The periodontal ligament (PDL) is a fibrous connective tissue that firmly binds the tooth to its surrounding bony socket. Its principal function is the mechanical support of the tooth during mastication [1–4]. Previous review studies by Moxham and Berkovitz (1995) [1], Nishihira et al. (2003) [3], and Chiba (2004) [4] have described the mechanical strength and viscoelasticity of this tissue structure. The extracellular compartment of the PDL tissue consists mostly of collagen fibre bundles with just a few oxytalan fibres, the latter running at approximately right angles to the collagen fibre bundles. These fibres are embedded in ground substances together with cells, blood vessels, and nerves [2]. This review article describes the mechanical properties of the PDL with emphasis on the relations between its mechanical function and structural components. Our intention is to explore these relations to improve our understanding of the mechanisms behind the tooth support function of the PDL.
2. The Mechanical Strength of the PDL
2.1. Measurement of the Mechanical Strength of the PDL
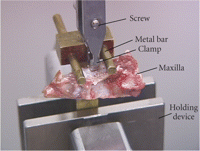
A pioneering study by Yamada's group was the first to measure the mechanical strength of the PDL [5]. They reported the force required to extract a tooth from its socket using specimens from human unembalmed cadavers (Table 1). Using a similar technique (Figure 1), Chiba and his colleagues measured the force required to extract teeth on the normal (Table 1) and experimentally altered PDL in experimental animals [6, 9]. Since these raw values showed a rather simple association with tooth size, standardised values for mechanical strengths (N/mm2) of the PDL per area facing the roots were then calculated [5] (Table 2). Thus, the mechanical strengths for human and mouse PDLs show similar values ranging between 1.2 and 1.7, and 1.8 and 3.0 N/mm2, respectively. Therefore, the application of standardisation principles eliminated this variation due to size differences among species.
Extraction forces of teeth in various species.
Mechanical strengths of the periodontal ligament in various species and of other connective tissues and artificial materials.
Picture of the device used to extract a whole tooth, which is similar to that reported by Yoshimatsu et al. (1956) [5] and modified after Chiba and Ohkawa [6]. The crown of the tooth is held by the clamp, which is connected to a load cell of a materials testing machine. The holding device is fixed to a crosshead of the machine, which moves downwards to measure extraction force.
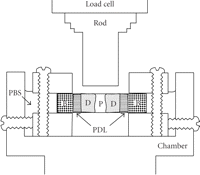
However, it was pointed out [11, 14] that tooth extraction procedure may introduce an artifact, since the fibres would tend to rupture unevenly due to the root curvature and the different vertical alignment of the fibres: the apical fibres in the vertical direction would rupture first, followed by the horizontal fibres. Further, it is difficult to measure the surface area of the PDL facing the tooth roots. To control these artifacts, Atkinson and Ralph (1977) used a tooth-PDL-bone complex for tensional loading of the PDL [11]. Further, Ralph (1982) developed a preparation of a transverse section of a tooth with its surrounding PDL and alveolar bone and a technique for loading the PDL in shear [14]. Mandel et al. (1986) have devised an elaborate technique for shear loading of the human PDL using a similar specimen [12]. Figure 2 presents a diagram showing an apparatus similar to their device. Thus, the artifact due to root curvature can be eliminated and it is now possible to obtain a standardised stress-strain curve of the PDL in shear [12–22] or tension [11, 23–25], allowing for comparisons between different species and between different sizes of teeth [28].
Diagram of the apparatus redrawn for clarity, which has been originally developed by Ralph (1982) [14] and has been modified by Mandel et al. (1986) [12]. A transverse section of a tooth root fastened between two metal plates is immersed in phosphate-buffered saline (PBS). The plates are fixed by screws within a chamber, which is mounted in a materials testing machine. As the chamber moves upwards at a constant speed, the periodontal ligament (PDL) is loaded by metal rod connected to a load cell of the machine. B: bone; D: dentine; P: dental pulp.
Table 2 shows the mechanical strengths of normal PDLs from human and experimental animals. The mechanical strengths of the PDL are of the same order in different sizes of teeth of different species. When compared to other connective tissues [28–30], the mechanical strength of the PDL was found to be most similar to that of skin, which comprises a three-dimensional mesh of collagen fibres. Interestingly, the mechanical strength of the rat tail tendon, which is composed of parallel-fibred collagen, is about 10 times those of the PDL. As cortical bone and tooth dentine containing large amounts of collagens are mineralised, their mechanical strengths are 10- to 40-fold greater than that of the PDL. Artificial materials such as glass fibre and steel show strengths 200- to 600-fold greater [30] than those of the PDL.
Mechanical strength is measured as the load needed to fracture a specimen, which causes breaks in the covalent linkages of the collagen molecular chains and slippages between the unit molecular chains [30]. From the functional point of view, the ratio of the breaking stress to the stress experienced during function may be used to determine the safety margin (safety factor) of each tissue, as pointed out by Alexander (1981) [31]. Engineers design structural elements to have safety margins between 5 and 10 [32, 33]. Komatsu et al. (1998) noted that the safety margin for the PDL ranges between 2 and 5 [21]. Tendons and bones have similar safety margins between 1 and 6 [29, 31]. Biological tissues or structures with this range of safety margins are considered strong enough to successfully fulfill their support function specific to their locations.
2.2. Mechanical Strength in Relation to Structure
In order to elucidate the tooth support mechanisms, Chiba's group systematically investigated the effects, on the mechanical properties of the PDL, of various experimental factors [4] such as periodontal disease [10, 22], hypofunction [18, 35, 36], orthodontic forces [37–39], treatment with inhibitors (lathyrogens) of collagen cross-linking and an inhibitor (hydrocortisone) of collagen degradation or turnover [8, 40–43], age [7, 17, 20, 44, 45], and root levels [19, 21]. They found that the mechanical properties were sensitive to both experimental alterations and to differences in the content, direction, and organisation of the collagen fibre components of the PDL.
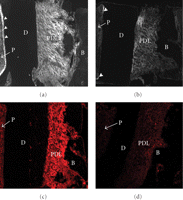
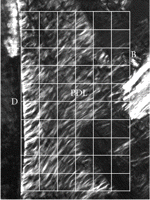
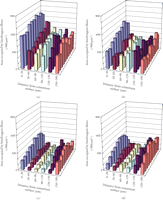
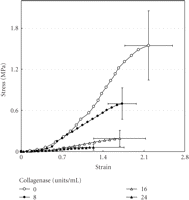
More specific investigations were done by in vitro treatment of mechanical specimens with specific enzymes [46]. The enzyme Clostridium histolyticum collagenase cleaves the peptide bonds in collagen with specificity for the Pro-X-Gly-Pro-Y region and particularly between X and Gly [47]. Immunofluorescent analysis reveals that this enzyme digests types I and III collagens (Figure 3), which are the dominant types of collagen in the PDL [2]. Kawada and Komatsu (2000) have investigated the role of collagen fibres in the mechanical support of the PDL using collagenase [34]. In vitro treatment of PDL specimens with collagenase caused concentration-dependent removals of collagens (Figures 4 and 5) and reductions in mechanical strength of the PDL (Figure 6) [34]. Image analyses were done after collagenase treatment of specimens: the area occupied by birefringent fibres within each square (30 × 30 μm) on each section (Figure 4) was analysed. In control specimens treated with PBS (Figure 5(a)), large regional differences in the area occupied by birefringent fibres were seen across the PDL: birefringent collagen fibres occupy 61%–78% of the squares in the PDL near the cementum surface. Because the region of the PDL near the bone is highly vascular and innervated, the birefringent fibre bundles occupy only 33%–48% of the area. Figures 5(b)–5(d) shows concentration-dependent digestions in the collagen fibres in the PDL specimens. The total areas occupied by birefringent collagen fibres in the regions 0–120 μm from the cementum surface are smaller at the higher concentrations of collagenase. However, since the regions 120–180 μm distant contain blood vessels, nerve fibres, and bones, the reductions are relatively small. Treatments with 8, 16, and 24 units of collagenase reduced the fibre areas by 20%–36%, 50%–75%, and 39–76%, respectively. From the analysis of the shear stress-strain curves (Figure 6), treatments with 8, 16, and 24 units of collagenase were found to reduce the mechanical strengths by 55%, 88%, and 96%, respectively (Figure 6). These data show that the periodontal collagens are load-bearing, key structural components that provide structural and functional integrity to the ligament.
Immunostaining of sections from PDL specimens treated with PBS (a), (c) or collagenase (24 units/mL) (b), (d) using an antibody against type I collagen (a), (b) or type III collagen (c), (d). Arrowheads indicate predentine. P: dental pulp.
Polarised light micrograph of the periodontal ligament (PDL) on the buccal side in an unstained bucco-lingal section of a mechanical specimen. Image analysis was done for each grid (30 × 30 μm), adapted from Kawada and Komatsu [34].
Changes in the collagen fibres of PDL specimens after collagenase treatment, as represented by the area occupied by birefringent fibres in each grid (Figure 4). Data were analysed for specimens treated with PBS (a), 8 units/mL collagenase (b), 16 units/mL collagenase (c), or 24 units/mL collagenase (d). Each column represents the mean of six specimens.
Stress-strain curves of the periodontal ligament obtained from transverse sections of the mesial root of rat mandibular first molars. Sections were incubated in 0, 8, 16, or 24 units of collagnase/mL of PBS at 37°C for 4 hours. Vertical and horizontal bars represent ±1 SD of 6 animals, reproduced from Kawada and Komatsu (2000) [34], by permission.
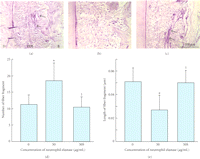
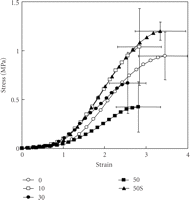
Ujiie et al. (2007) have also recently investigated the effect of treatment of PDL specimens with elastase on the mechanical strength [48]. They found that in vitro treatment with elastase increased fragmentation of the oxytalan fibres (Figure 7) and reduced the mechanical strength of the PDL specimen (Figure 8) in a concentration-dependent manner. The addition of an elastase inhibitor effectively antagonised these effects. This study suggests that the oxytalan fibres may play a role in the mechanical support of the PDL.
Fragmentation of oxytalan fibres in periodontal ligament (pdl) by neutrophil elastase. (a)–(c) Sagittal sections of the distal side of the distal root of rat mandibular first molars. Histological sections were stained with aldehyde fuchsin-staining. (d) Number of fibre fragments in sections. (e) Length of fibre fragment in sections. Specimens were treated with 0 (A), 50 (B) μg/mL of neutrophil elastase (50), or 50 μg/mL of neutrophil elastase +5 mM sivelestat (elastase inhibitor) (c) (50S). Each column and bar represent the mean + 1 SD of six animals. d: dentine; b: bone. ∗ P <.05 compared with the control; † P <.05 compared with the elastase-treated specimens, reproduced from Ujiie et al. (2008) [48], by permission.
Stress-strain curves of the periodontal ligament obtained from transverse sections of the mesial root of rat mandibular first molars. Sections were incubated in 0, 10, 30, or 50 mg/mL of neutrophil elastase or with 50 μg/mL of neutrophil elastase +5 mM sivelestat (50S). Vertical and horizontal bars represent ±1 SD of 6 animals, reproduced from Ujiie et al. (2008) [48], by permission.
It has been reported that the interfibrillar ground substances occupies 65% (volume ratio) of the collagen fibre bundles or sheets in the rat PDL [2]. Further studies have investigated the possible roles of interfibrillar ground substances in the mechanical support of the PDL. After an in vitro treatment with α-amylase, scanning electron microscopy (SEM) and histochemistry observed removal of interfibrillar substances and remnant, exposed collagen fibre bundles [49]. The treated PDL specimens had concentration-dependent reduced mechanical strengths. However, as the authors did not quantify the fibre components in the specimens after the treatment, it is difficult to determine the relative contribution of interfibrillar substances to changes in strength. Other studies have used EDTA to remove the interfibrillar substances, and this has been confirmed in PDL specimens by immunohistochemistry with an antibody against chondroitin 6-sulfate and an antibody against chondroitin 4- and dermatan sulfate which are major proteoglycans of the interfibrillar substances in the PDL [50, 51], as well as via SEM. These studies showed that concentration-dependent decreases in mechanical strength. Recent immunohistochemical and ultrastructural studies have shown that proteoglycan filaments run orthogonal and parallel to the collagen fibrils in human periodontal ligament and gingiva [2]. It is assumed that the treatment with α-amylase or EDTA reduced the mechanical strength of the PDL not only by removing the interfibrillar substances but also by reducing the interactions between collagen fibrils and proteoglycans.
3. The Viscoelastic Response of the PDL
From the functional point of view, physiological stress levels are below the mechanical strength of the tissues and physiological responses exhibit time-dependence. Such functional mechanical responses may intimately be related to the viscoelastic time-dependent responses. The viscoelastic responses of the PDL have been examined by hysterysis, creep, and stress-relaxation tests. Kurashima (1963) [52] studied the viscoelastic behaviour of the PDL by measuring stress-relaxation responses in the human PDL and its applicability to the Maxwell model. Bien (1965) described the relaxation of rat teeth using a Maxwell model [53]. Wiils and Picton (1972, 1978) used a Voigt model to describe the creep behaviour of the PDL [54, 55]. Middleton et al. (1990) used a linear viscoelastic model to simulate the behaviour of the PDL [56]. Provatidis (2000) described a viscoelastic behaviour using a finite element technique [57].
The studies by Moxham and Berkovitz are not only a description of the creep behaviour of the PDL of the rabbit incisor (1981) [58] but also an investigation into a role of collagen crosslinks in the creep behaviour (1984) [59]. By administration of an inhibitor of collagen cross-linking (lathyrogens), reductions of collagen cross-linking in collagen fibres occur. As expected, the instantaneous and gradual mobilities of the tooth were greater in the lathyritic than in the pair-fed animals, indicating a role of cross links of the collagen fibres in the viscoelastic response of the PDL.
The viscoelastic response of the PDL has also been demonstrated by varying the velocity of loading, in studies by Chiba and Komatsu (1993), Komatsu and Chiba (1993), and Komatsu and Chiba (1996) [16, 60, 61]. These experiments investigated the shear stress-strain properties of the PDLs in the rat incisor and molar teeth at a wide range of loading velocities using a custom-made testing apparatus. The slowest velocity (1 mm/24 h) imitates the eruption rate of the rat mandibular incisor; the fastest one was 104 mm/24 h, equivalent to 7 mm/min. They found that the linear parts of the stress-strain curves became steeper and the shear mechanical strength increased with increasing velocity, demonstrating typical characteristics of viscoelastic tissues. The mechanisms responsible for decreased mechanical stress at slower strain rates have yet to be determined but may involve the increased time available for stress-relaxation of the tissues at lower velocities [60].
Several methods of measurement and analysis of the stress-relaxation response of the PDL have recently been reported [13, 17, 20, 26, 62–66]. The distinctive property of the stress-relaxation of the PDL is that the amount of stress-relaxation during 10 minutes reaches about 50% of the initially applied stress [17], which is greater than those of other soft connective tissues. These phenomena indicate that the PDL tissue dissipates the strain energy stored in the tissue, during excessive force application, through viscoelastic responses [26, 27, 62]. This mechanism could reduce the risk of injury to the PDL in the case of prolonged static deformation. This sort of viscoelastic response may play an important physiological role in the tooth support mechanisms of the PDL.
4. Analysis of Stress-Relaxation Response of the PDL
In this chapter, I will introduce a typical method for measurement and analysis of stress-relaxation response of the PDL as described by Sanctuary, Komatsu, and Botsis (2003, 2007) [62, 63].
4.1. Measurement of Stress-Relaxation Responses
4.1.1. Preparation of Specimens
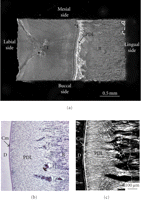
From a rabbit hemimandible, a transverse section (about 0.25 mm in thickness) of the middle region of the incisor tooth with its surrounding PDL and bone is cut. Then, the original width (Wi) of the PDL can be measured with a stereomicroscope as the distance (about 0.45 mm) between the bone and cementum surfaces at the central region on the lingual side of the tooth. Both of the lateral parts of each section are trimmed, and then a final specimen is obtained. The final rectangular specimen consists of tooth, PDL, and bone (Figures 9(a) and 9(b)). The direction of most of the principal collagen fibre bundles in the PDL of the specimen is almost parallel to the direction of testing, as evident under polarised light microscopy (Figure 9(c)). The sectional area (SA, mm2) of the PDL can be calculated as the breadth (mm) × thickness (mm) of the specimen.
Preparation of mechanical specimen for uniaxial loading. (a) Mechanical specimen of bone-PDL-tooth complex obtained from a transverse section of the rabbit mandibular incisor. (b) Histological presentation of periodontal ligament. Sections were cut in parallel to the sectional surface of mechanical specimens (Figure 9(a)). Toluidine blue staining. (c) Polarised light microscopic image of the same section. White arrowheads indicate crimps of the collagen fibre bundles. D: dentine; Cm: cementum; PDL: periodontal ligament; B: bone.
4.1.2. Experimental Setup
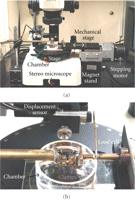
Stress-relaxation tests require precise and quick movements of the actuator and preservation of the initially applied deformations during the relaxation process [67]. A novel uniaxial testing machine was designed by Komatsu and Chiba (2001) [23] (Figure 10). For stress-relaxation tests, this machine was improved; the improvements [62] include, (1) a stepping motor with greater torque, (2) uniaxial movement of the actuator by more precise regulation via a PC-controlled stepping motor, (3) a new load cell with negligible compliance, and (4) improved slippage control of the specimen between clamps during repeated mechanical tests via the use of waterproof sandpaper affixed to the clamps [68]. By using the improved testing machine, initial deformations were able to remain nearly constant during relaxation tests, with mean values for the deformations of 57–56, 78–77, and 99–97 μm over a 300-second period. These changes are negligible compared with the overall deformation levels, indicating a satisfactory regulation during their stress-relaxation tests.
(a) Experimental setup: horizontal testing apparatus built on a stereomicroscope. (b) A magnified picture of specimen clamps and chamber, adapted from Komatsu and Chiba (2001) [23].
4.1.3. Determination of the Nondestructive Range of Deformation
A standard (mean) load-deformation curve is computed from several specimens to estimate the nondestructive range of deformation for the PDL specimens for stress-relaxation tests. It has been shown that non-destructive range of deformation does not exceed the middle portion of the linear segment of the stress-strain curve for a PDL specimen [68, 69]. Therefore, the functional and non-destructive range of deformation may be determined to be below 100 μm from the mean load-deformation curve [62].
4.1.4. Preconditioning
To ensure the reproducibility of results as pointed out previously [28, 62, 63, 70], each specimen is subjected to three cycles of tensile and compressive loadings between +35 and −35 μm before stress-relaxation tests.
4.1.5. Stress-Relaxation Test
The specimen is then stretched to a deformation level of 35 μm at the fastest speed (63 mm/min) of the testing machine, the movement of the actuator is abruptly stopped, and the deformation is kept constant for 300 seconds to obtain a load-relaxation curve. The specimen is then returned to its original width at the same speed. After a 300-second recovery period, the stress-relaxation tests are repeated sequentially at three different deformation levels (55, 75, and 95 μm) with a recovery period of 300 seconds between each test.
The load-relaxation response after the initial deformation is characterised by a sharp decrease in load, followed by a gradual decrease. Greater load levels are observed at greater deformation levels.
4.1.6. Failure Test
Finally, the specimen is first loaded in compression and then in tension at 1 mm/min until rupture of the PDL. The mechanical homogeneity of the specimen can be assessed by comparing its load-deformation curve with the standard load-deformation curve.
4.1.7. Data Analysis
Load  and deformation
 at time
 are transformed into
stress
  and strain
 , respectively, using
the formulae,
  , and
, and
 [23].
[23].
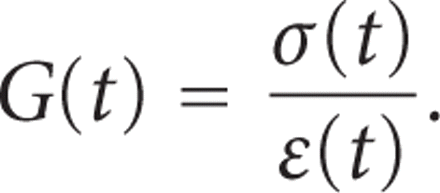
The relaxation process of a biological specimen may be represented as a
relaxation modulus  :
: 
G(t) is then normalised with
respect to the initial value  to give a normalised
relaxation modulus
  as
as 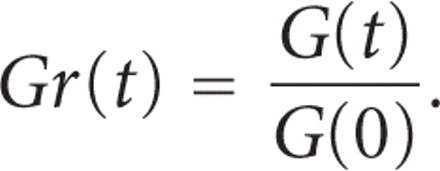
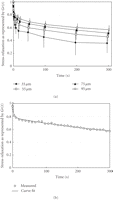
Figure 11(a) shows mean
stress-relaxation responses of the PDL at different deformation levels as
represented by  . In this instance,
notice that the values for
  initially decreased
rapidly and then did so gradually thereafter. The amounts of the
stress-relaxations during 300 seconds are less at greater deformations
(ANOVA,
  ):
the mean relaxations in this series were 63%, 53%, 48%,
and 44% at 35, 55, 75, and 95 μm, respectively. As the
normalised relaxation curves
  at different strains
do not coincide, the behaviour of the PDL can be considered as nonlinear
[63, 71]. The nonlinearity of
responses implies that several mechanisms are involved in tooth support
[53, 62, 63, 71].
(a) Stress-relaxation as represented by  for rabbit periodontal ligament. Each point and bars represent mean
± 1 SD. (b) Typical example of exponential curve fitting.
Measured values (open circles) are well expressed by an equation:
 ,
reproduced from Komatsu et al. (2007) [62], by permission.
A generalised model for viscoelastic materials can be considered in which
several Maxwell elements are assembled in parallel [71]. The relaxation process may be
expressed as  where Ai and
 are the ratio and relaxation time
  of each exponential
function, respectively.
The stress-relaxation process of the PDL as represented by
 is well described by
a function with three exponential decay terms and a constant (Figure 11(b)) as
 where
where  ,
and C is constant, as in the PDLs of rats [17, 20, 26, 62], humans [13], and cows [63]. As
 ,
,
 ,
and
,
and  are 0.2–0.4 seconds, 2–4 seconds, and 100–400 seconds,
respectively, the stress-relaxation process may consist of short-, medium-,
and long-term relaxation components.
  (ANOVA,
  ),
),
 (ANOVA,
  ),
and
  (ANOVA,
  )
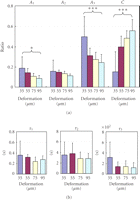
are less at greater deformations (Figure 12(a)). In contrast,
C is greater at greater deformations (ANOVA,
 ;
Figure 12(a)). The
three relaxation times show decreasing tendencies at greater deformations
(Figure 12(b)).
Parameters of stress-relaxation. (a) Ratios
(Ai) and (b)
relaxation times ( )
of the three exponential decay functions (Figure 11(b)) at the different
deformations. Each column and vertical bar represent mean + 1
SD.
  (ANOVA);
  (ANOVA), adapted from Komatsu et al. [62].
The lower stress-relaxation values during 300 seconds at greater deformations (Figure 11(a)) could be attributable to decreases in the ratios of the short- and long-term relaxation components (Figure 12(a)) and, to a lesser extent, to the changes in the relaxation times (Figure 12(b)). In other words, the viscous components may contribute relatively less than do the elastic components at greater deformations. It has been suggested that the decrease in the relaxation rate with increasing strain could reflect larger strains causing greater water loss, which causes the tissues to be more elastic (less viscous) than tissues subjected to lower strains [72].
4.2. Stress-Relaxation Response in Relation to Structure
Although the viscoelastic response of any biological tissue is likely related to its structure, this relation has not been adequately investigated in the PDL [20].
4.2.1. Video-Microscopic Recording of the PDL Structure During Stress-Relaxation Test
Komatsu and Chiba [23] have shown by simultaneous recordings of the mechanical responses coupled with polarised-light video-microscopy that the area and brightness of the birefringent collagen fibre bundles in the PDL specimens are intimately related to its stress-strain behaviour. Quantitative polarised-light microscopy has shown to be useful for investigating the macromolecular orientation and organisation of collagen fibres in living connective tissues without the need for staining [73, 74].
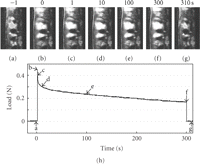
Komatsu, Sanctuary, and Botsis (2007a) [62] further applied the simultaneous recording system to observe the structural basis for the mechanisms of viscoelastic response of the PDL. Before deformation application (Figure 13(a)), most of the birefringent PDL collagen fibre bundles run parallel to the deformation direction. Immediately after applying of a deformation of 95 μm (Figure 13(b)), the birefringent fibres are stretched towards the direction of uniaxial testing. During the load-relaxation for 300 seconds (Figures 13(b)–13(f), the stretched bundles show indistinct changes in their arrangement, although there are gradual increases in the brightness of the birefringent fibres during the relaxation. After the specimen is returned to its original width, it takes several seconds for the PDL fibres to recover their original waviness and birefringence (Figure 13(g)).
Simultaneous recording of video microscopic images and load values during stress-relaxation under a constant deformation of 75 μm. The video images (a)–(g) correspond to each point (a)–(g) on the load-relaxation curve (h).
During stress-relaxation under each deformation, the area occupied by the birefringent fibres initially decreases rapidly and then gradually (Figure 14). In this series, the amount of the decrease under 95 μm of deformation was less than those under other deformations. In contrast, during stress-relaxation under each deformation, the brightness of the birefringent fibres initially increases rapidly and then only gradually thereafter (Figure 14). In this series, the mean values of the brightness at 55, 75, and 95 μm were greater than those at 35 μm. This image analysis reveals the increasing tendency of the brightness of the birefringent stretched collagen fibres of the PDL during the stress-relaxation: the brightness correlates with progress of stress-relaxation under the four different deformations. The increased brightness may reflect that the collagen molecules and fibrils within the stretched collagen fibre bundles progressively align along the direction of the initial strain application during the relaxation [62]. Such internal rearrangement of collagen could be driven by the strain energy imparted to the specimen on initial stretching, which gradually diminishes as the stress relaxes, as suggested by X-ray diffraction studies [75, 76].
Changes in relaxation modulus  , area, and
brightness of the birefringent fibres in the periodontal ligament
under four different deformations. Each point represents the mean of
six specimens, adapted from Komatsu et al. [62].
4.2.2. Stress-Relaxation Responses after Structural Modifications
Komatsu et al. (2007b) investigated into the effect of in vitro digestion of
collagen with collagenase on the stress-relaxation process of PDL specimens
[77]. The
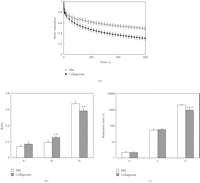
collagenase (8 units/mL)-treated specimens relaxed more rapidly than the
control specimens over a 600-second period (Figure 15(a)). The amount of relaxation
of the collagenase group was 37% greater than that of the PBS group
( ).
The stress-relaxation processes, as represented by
  , are well described
by a function with three exponential decay terms. The ratio
(
 )
and relaxation time (
 )
of the third exponential term for the collagenase group (Figures 15(b) and 15(c)) were significantly
less than those for the PBS group. These results show that the partial
removal (20%–36%, see Section 2) of the collagen fibres from
the PDL specimens mainly causes decreases of the ratio and relaxation time
for the long-term relaxation component. The decrease in the ratio may
correspond to the decrease in the quantity of the collagen fibres, while the
decrease in the relaxation time may be related to the decreased organisation
of the collagen fibres. Therefore, it is likely that the viscoelastic
properties of the collagen fibres may play an important role in the
long-term relaxation component (
 seconds) of the stress-relaxation process in the PDL. In the KWW relaxation
component (
 seconds) of bone collagen prepared by demineralization of bone, the
viscoelastic properties of the collagen fibres are also likely to play a
role [78].
(a) Stress-relaxation curves as represented by
 for specimens
treated with PBS or 8 units/mL collagenase, reproduced from Komatsu
et al. [77],
by permission. Measured values
  are well
expressed by an equation:
  .
(b) Ratios (Ai) and (c)
relaxation times (
 )
of the three exponential decay functions. Each column and vertical
bar represent the mean + 1 SD.
  and
and  compared with the PBS group.
5. Dynamic Measurements of Viscoelastic Responses of the PDL
The viscoelastic responses of the PDL such as stress-relaxation to a load and creep to a strain, as mentioned in the previous chapters so far, are static properties. In contrast, the mechanical responses to oscillations are dynamic properties. With dynamic tests, the frequency dependent viscoelastic responses can be examined.
Sanctuary et al. (2005) have subjected bovine PDL specimens (preparations similar to
those in Figure 9) to
tension-compression harmonic oscillations under physiological conditions, that is,
at strain amplitudes between  and
and
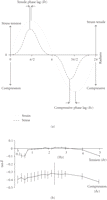
 with frequencies between 0.2 and 5 Hz (Figure 16(a)) [26,
63]. The difference
between the peak strain and the peak resulting stress is called phase lag and is
expressed as an angle (δ). For viscoelastic systems,
 .
The tangent δ is proportional to the ratio between the energy that is
dissipated (loss modulus
  )
and the energy that is stored (storage modulus
  )
in the system. The phase lag (
 )
was found to be greater in compression than in tension, but independent of this
range of frequency (Figure
16(b)) in line with other biological tissues. These results suggest that the
dissipated energy was higher in compression than in tension in the PDL tissue.
(a) Phase lag (δ) is the angular difference between peak strains and
peak stresses. Values for tensile and compressive oscillations may be
determined. (b) Phase lag δ, plotted as tan δ, for the tensile
( )
and compressive (
 )
half cycle obtained from bovine PDL specimens. Vertical bars indicate
±1 SD, reproduced from Sanctuary et al. [26], by permission.
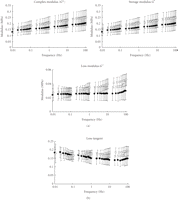
Tanaka et al. (2006) [79] have
measured dynamic shear properties of the porcine incisor and molar PDLs at an
oscillation amplitude (Figure
17) of  %
with a wide range of frequencies (0.01–100 Hz). They found that storage
modulus
  increased with frequency for both PDLs while loss modulus
  did so only for the incisor PDL (Figure
18(a)).
  ranged between
0.1 and 0.2, which was greater in the incisor than in the molar PDL with frequencies
between 1 and 100 Hz (Figure
18(b)). The incisor PDL may be considered to have better shock-absorbing
characteristics for sudden loading [79].
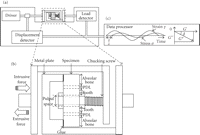
(a) Diagram of the dynamic viscoelastometer. (b) Chucking device with a transverse section of a tooth root. (c) A schematic record of dynamic stress and strain during a sinusoidal oscillating strain, reproduced from Tanaka et al. [79], by permission.
Dynamic shear properties of porcine periodontal ligament. (a) Complex modulus
 ,
storage modulus
  ,
and loss modulus
  as a function of frequency. (b) Tangent
  as a
function of frequency. Data were obtained from incisor (white circle) and
molar (black circle) periodontal ligaments. Vertical bars indicate 1 SD,
reproduced from Tanaka et al. [79], by permission.
Shibata et al. (2006) [27] have
investigated the mechanical response of the bovine PDL at  %
of the PDL width with a frequency of 1 Hz at different root levels and different
locations around the roots. It was found that the hysterisis and phase lag in
compression were much higher than in tension, but independent of root levels (Figure 19) and locations around
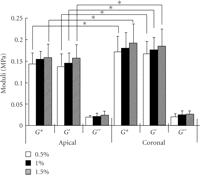
the root. Tanaka et al. (2007) [80] have also investigated dynamic shear properties of the porcine molar
PDL at an oscillation amplitudes of
  0.5, 1, and 1.5% with a wide range of frequencies (0.01–100 Hz). They
found that at 2 Hz the coronal PDL had a slight, but significantly, greater storage
modulus
  than the apical PDL while loss modulus
  were similar between the two regions (Figure 20). The discrepancy between the former and latter results
remains unknown but might be due to the different modes of loading
(tension-compression and shear) and/or the different spices.
Phase lags (a) and hysterisis (b) in tension and compression obtained from bovine periodontal ligament specimens at different root levels, reproduced from Shibata et al. [27], by permission.
Dynamic shear properties of complex  ,
storage
  ,
and loss
  moduli for the apical and coronal regions of porcine PDL. Vertical bar
indicates 1 SD.
  ,
reproduced from Tanaka et al. [80], by permission.
In the bovine PDL as mentioned above [26, 27], the phase lag values in tension and compression ranged between 0 and 0.1, and 0.2 and 0.4, respectively. The dynamic measurements for bovine and porcine PDLs suggest that the PDL can absorb more energy in compression than in shear and tension.
6. Concluding Remarks
Recently, gene-targeted and mutant animals have been used as experimental models to explore the role of individual constituents in the biomechanical behaviour of connective tissues. Investigations into stress-relaxation and strain rate sensitivity of tendons from genetically engineered mice have shown greater and faster stress-relaxation among decorin knockout animals and the elastic parameter was less among those with reduced type I collagen [81]. Histological findings in knockout mice suggest that decorin, fibromodulin, and lumican regulate the fibrillar and suprafibrillar organisation of collagen in the PDL [82, 83].
There may be further mechanisms of mechanical adaptation to functional stress including molecular adaptation to mechanical stress, which is now under investigation in the field of the biomechanics. Further, there have recently been an increasing number of reports on altered gene expression and protein changes in fibrillar and net-forming collagens triggered by the sensing and responding of connective tissue cells to mechanical loads [84].
Future studies using such approaches should further elucidate the relations between viscoelastic behaviour and structure of the PDL.
Acknowledgments
The author would like to thank one of the Chief Editors, Dr. Theodore Eliades, for providing him the opportunity to write this review article. This manuscript is the result of extensive and constructive discussion with many people. Among these, the author would like to especially thank Mototsugu Chiba, Professor Emeritus of Tsurumi University; Andrus Viidik, Professor Emeritus of Aarhus University; and Professor John Botsis, Ecole Polytechnique Federale de Lausanne. He also wishes to express his thanks to many authors and publishers who permitted him to reproduce their figures in this review. The preparation of this manuscript was partially supported by Japanese MEXT.HAITEC (2005–2009).
- Received February 26, 2009.
- Accepted August 26, 2009.
- © 2010 Koichiro Komatsu.

