


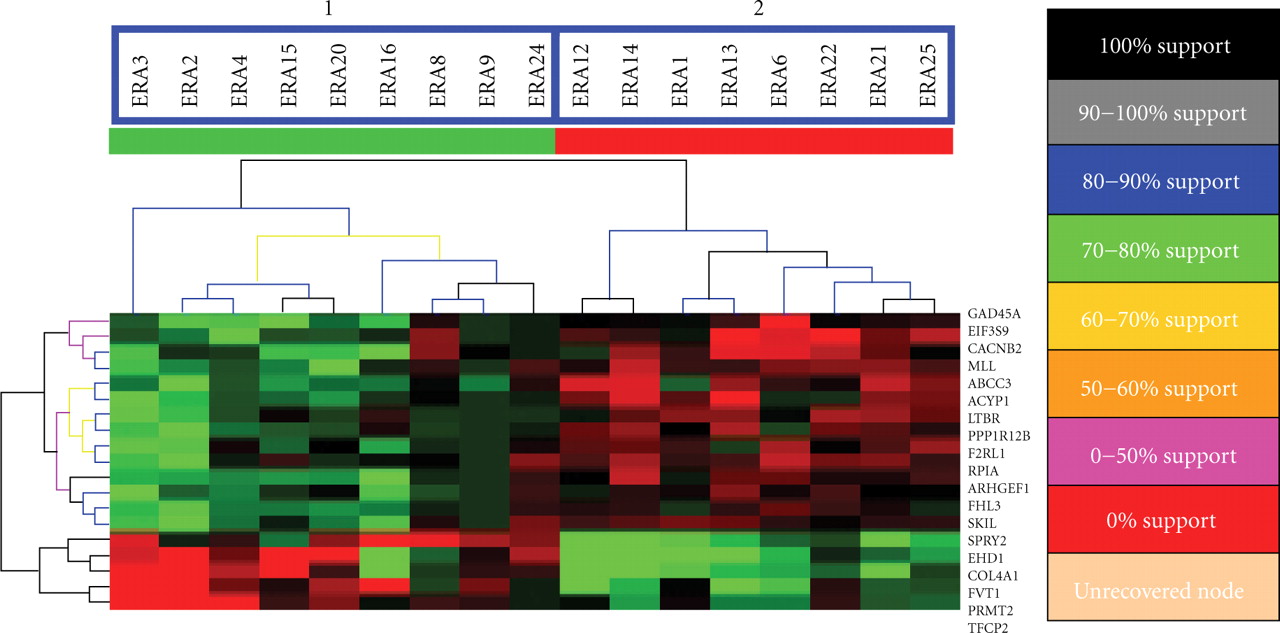
Figure 2
Support tree hierarchical clustering was applied to the expression profiles of 19-predictor genes among the 17 patients. A. Jackknife resampling was used with permutation 500 times. The color codes correspond to a given level of support. Branchs 1 and 2 are significantly separated according to their disease severity (P = .00004, Fisher's Exact Test).