


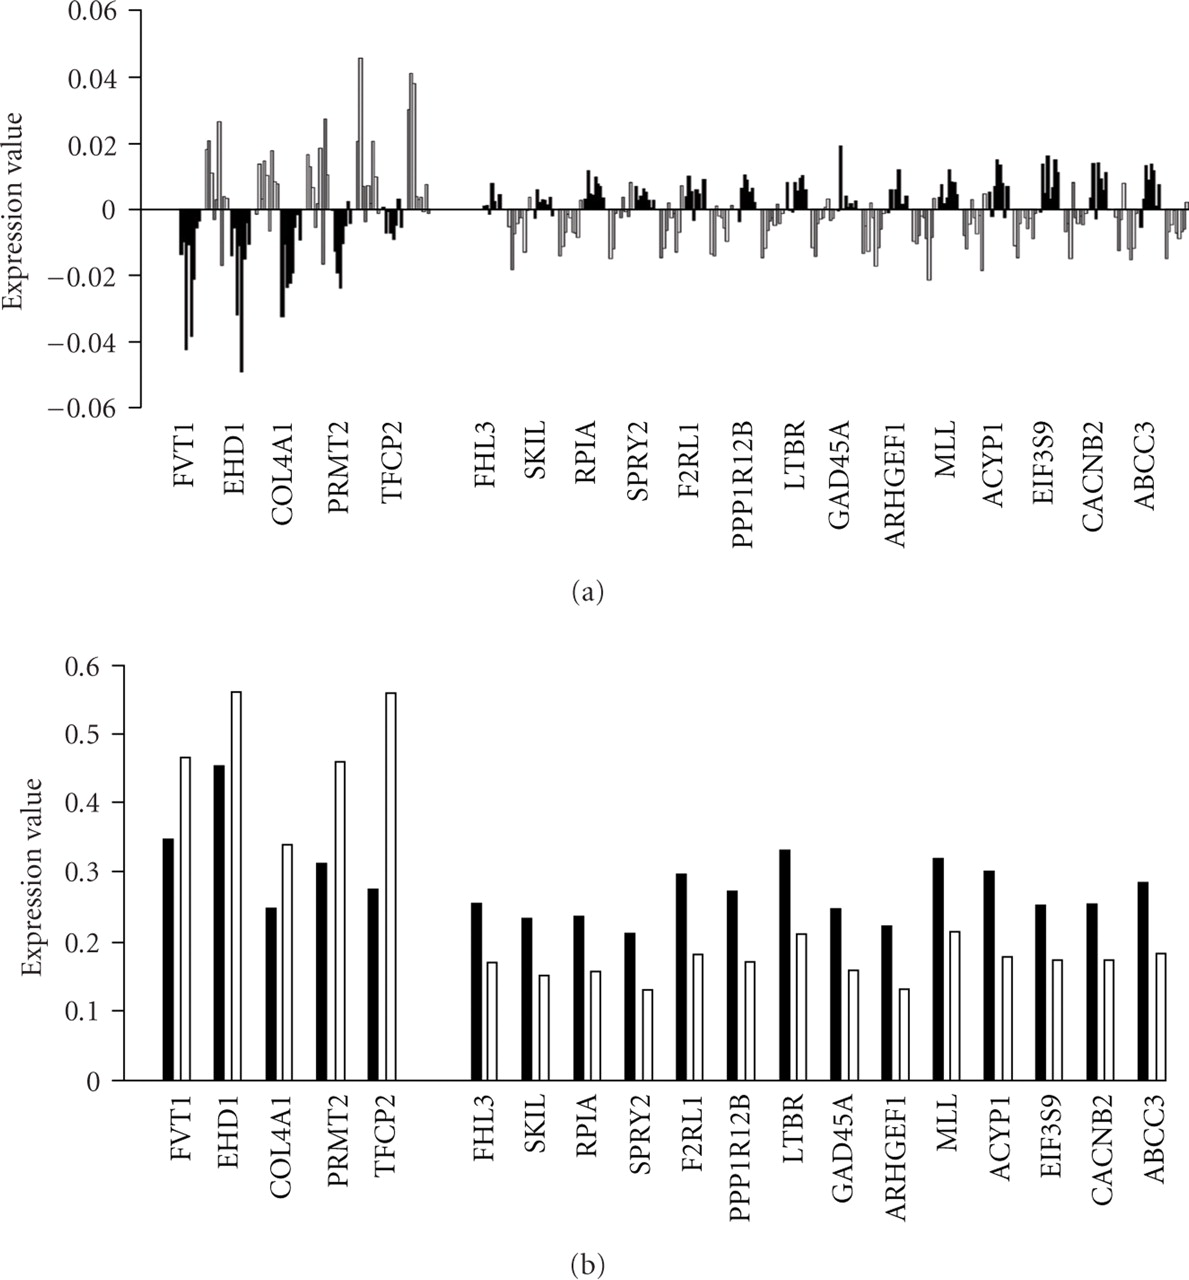
Figure 3
Identity and expression levels of the 19 genes in individuals comprising the future mild and future severe disease groups are shown by bar graphs. (a) The normalized polished expression data of these 19 genes in severe and mild groups. (b) The original expression data without normalization in the future severe and mild groups for the 19-predictor genes. Note that standard deviations are not shown because the t statistic was calculated based on permutations. Black bars represent the severe group, white bars represent the mild group.