


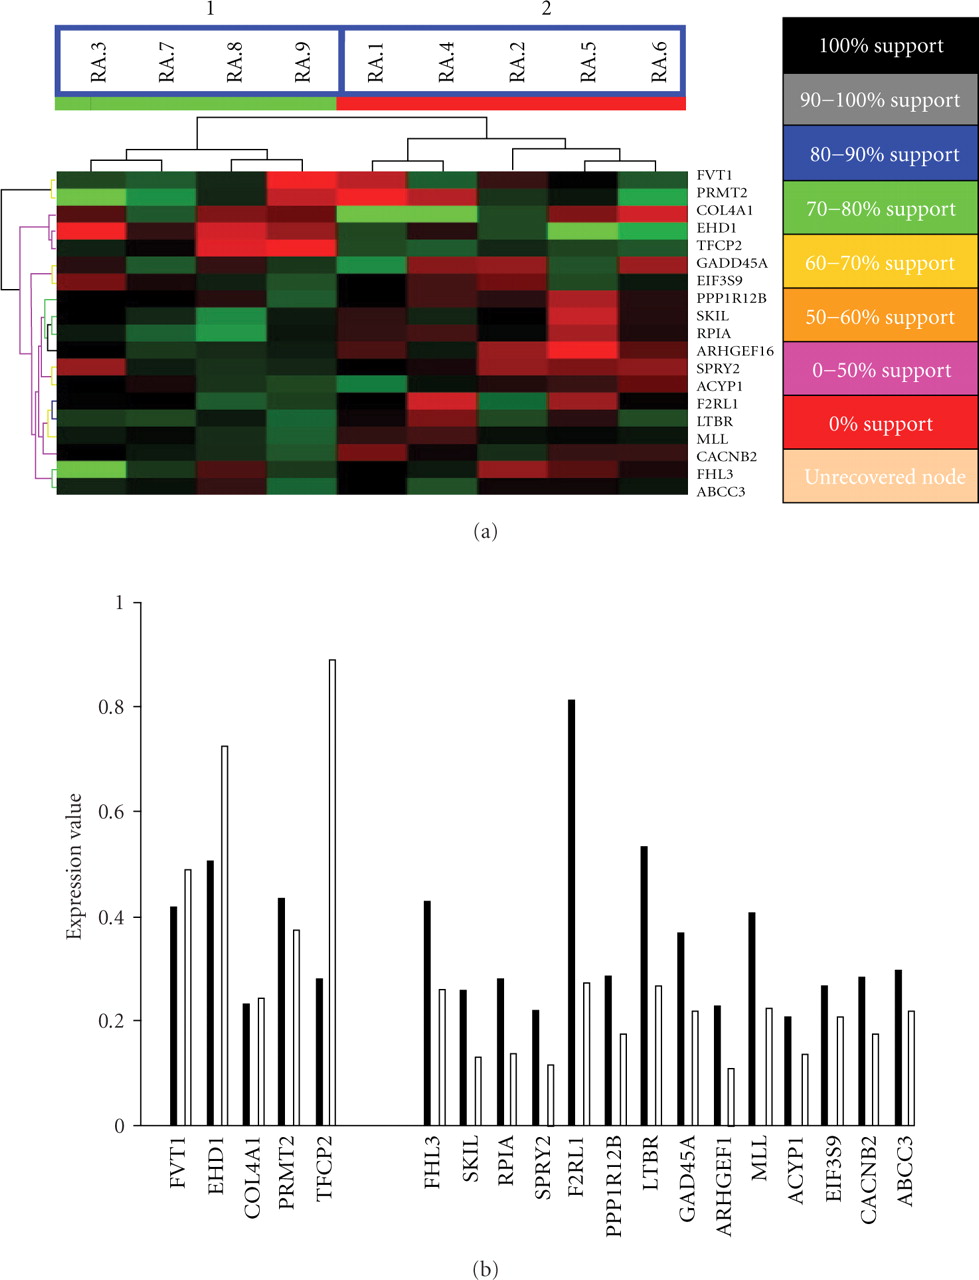
Hierarchical classification of an independent established RA cohort using the 19-gene expression profile. (a) Support tree hierarchical clustering was applied to the expression profile of the 19-predictor genes in 9 RA patients. Jackknife resampling was used with 500 permutations. The color codes correspond to a given level of support. Branch 1 and 2 are significantly separated according to their disease severity. (P = .008, Fisher's Exact Test). (b) The original expression data without normalization in the severe and mild groups for the 19-predictor genes in 9 RA patients. Note that standard deviations are not shown because the t statistic was calculated based upon permutations. Black bars represent the severe group and white bars represent the mild group.