- Institution: Stanford Univ Med Ctr Lane Med Lib/Periodical Dept/Rm L109
- Sign In as Member / Individual
CALCIUM: A Role for Neuroprotection and Sustained Adaptation
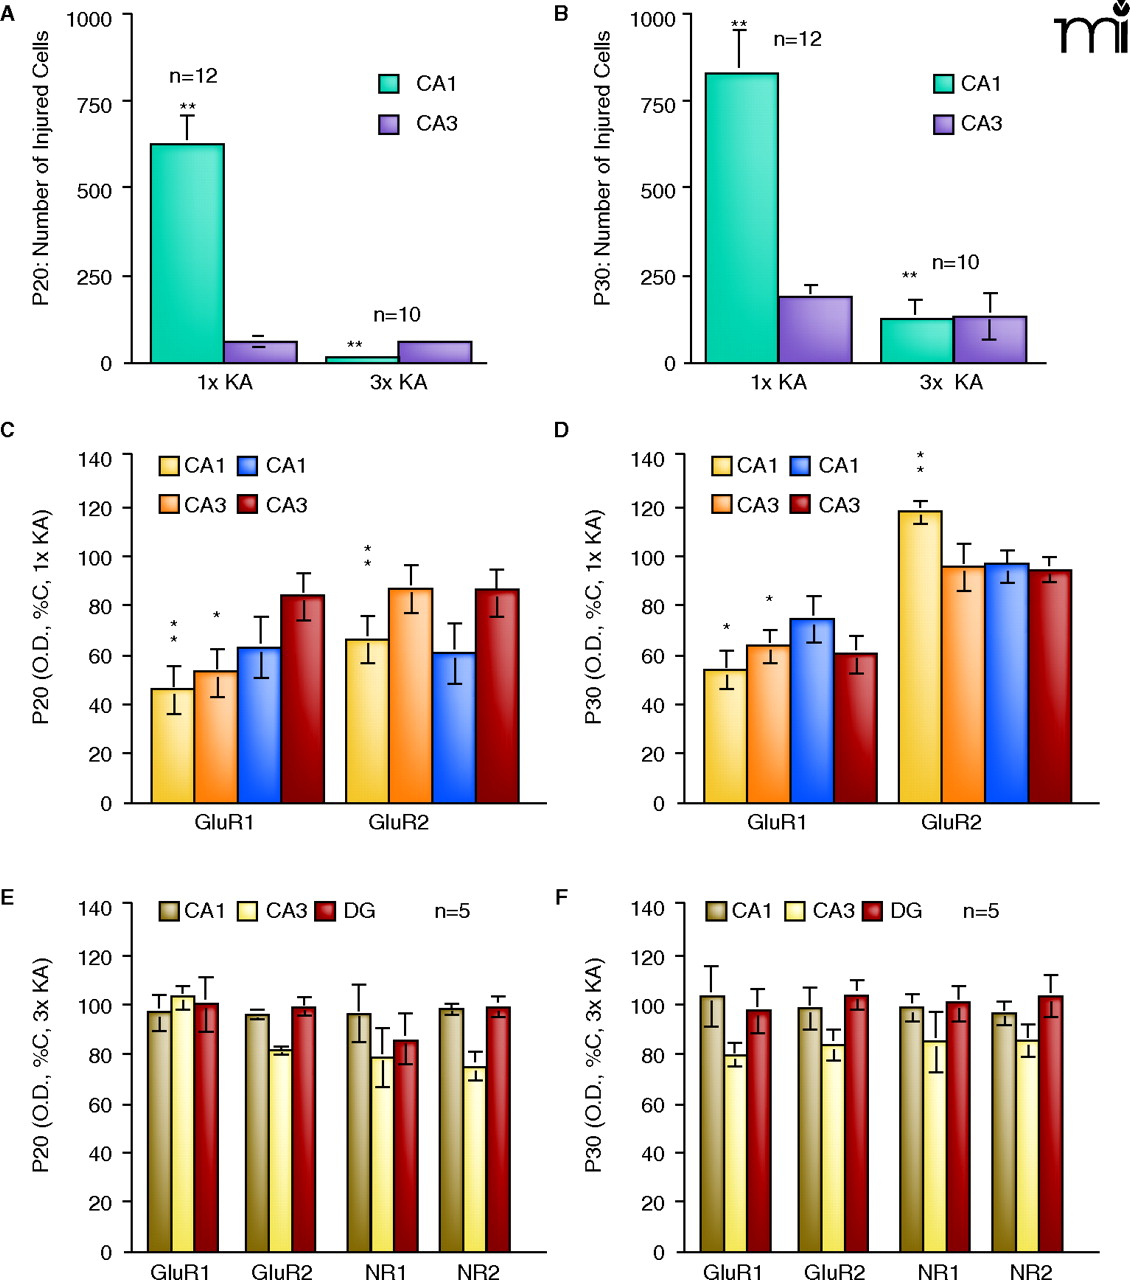
Figure 4.
Quantification of injured and protective effects. Graph of injured cells at P20 (A) and P30 (B). AMPA receptor immunodensity shows significant decreases in GluR1A expression after 1×KA at P20 (C) and P30 (D); however, increases in GluR2B were observed at P30. AMPA and NMDA receptor immunodensities show no significant difference versus controls after 3×KA at P20 (E) and P30 (F). Bars are means ± SEM of 5–7 animals per group. One-way ANOVA, *p ≤ 0.05, **p ≤ 0.01. DGd, dentate gyrus dorsal; DGv, dentate gyrus ventral. Modified from (32, 45). Reprinted with permission.

