- Institution: Stanford Univ Med Ctr Lane Med Lib/Periodical Dept/Rm L109
- Sign In as Member / Individual
CALCIUM: A Role for Neuroprotection and Sustained Adaptation

Figure 5.
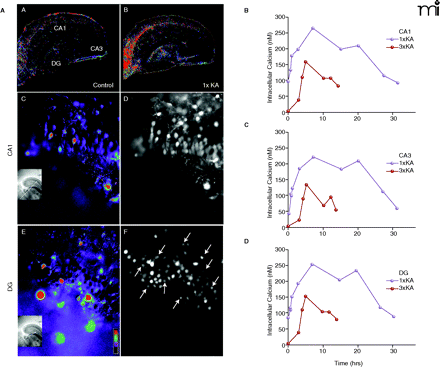
Ca2+imaging following single vs. multiple early-life seizures. A. The FURA 2AM dye indicator was used to measure intracellular Ca2+ at P13 after single (1×KA) or multiple (3×KA) episodes of KA-induced seizures that were induced on P6, P9, and P13. (A). Ca2+ visualization of hippocampal neurons loaded with Fura-2AM in control slices show low amounts of Ca2+ in presence of TTX. (B). Five hours after 1×KA treatment, basal Ca2+ amounts were elevated throughout the hippocampus but particularly in CA1 [(C), (D)] and DG [(E), (F)]. B. Time course of elevated basal Ca2+ concentrations after 1×KA vs 3×KA in CA1 (B), CA3 (C), and DG (D).


