|
 
 |
| ORIGINAL ARTICLE |
|
| Year : 2016 | Volume
: 4
| Issue : 2 | Page : 71-74 |
|
Study of the cranial (cephalic) and facial (prosopic) indexes of Ukwuani indigenes in Nigeria
Ugochukwuka Ojieh, Mamerhi Enaohwo, Abimbola Ebeye
Department of Anatomy and Cell Biology, Delta State University, Abraka, Delta State, Nigeria
| Date of Web Publication | 18-Apr-2017 |
Correspondence Address:
Ugochukwuka Ojieh
Department of Anatomy and Cell Biology, Delta State University, P. M. B. 1, Abraka, Delta State
Nigeria
 Source of Support: None, Conflict of Interest: None  | Check |
DOI: 10.4103/2315-7992.204686

Background: It is noted that the head and face shapes of humans from different ethnic groups vary markedly. The cause of these variations has been attributed to several environmental factors. Measurements of these indexes become a necessity to prove that individuals from a particular ethnic group have similar head and face forms. Aim: The present study was aimed at measuring the cephalic and prosopic indexes of Ukwuani indigenes of Delta State. Materials and Method: A total of 315 subjects (165 males and 150 females) were selected by simple random sampling and were measured for their cranial and facial lengths and breath and the respective indexess were calculated. Results: Males had a mean prosopic index of 99.15 whereas females had a marginally lower mean prosopic index of 94.54, both belonged to the hyperleptoprosopic facial group and observed differences between both genders were statistically not significant (P = 0.25) The mean cranial index in males and females was 80.21 and 79.04, respectively, both belonged to the mesocephalic cranial group and observed differences between both genders were statistically significant (P = 0.01). Conclusion: There was no statistically significant gender difference with regards to prosopic index but with regards to cephalic index the observed gender difference was statistically significant.
Keywords: Cephalic index, hyperleptoprosopic, mesocephalic, prosopic index
How to cite this article:
Ojieh U, Enaohwo M, Ebeye A. Study of the cranial (cephalic) and facial (prosopic) indexes of Ukwuani indigenes in Nigeria. Ann Bioanthropol 2016;4:71-4 |
| Introduction | |  |
Measurements in anthropometry serve as viable means through which variations in human body dimensions can be effectively observed for studies. It is observed that morphological features of different races are not randomly distributed but appear in geographical clusters.[1] These variations are caused by various environmental, ecological, biological, racial and nutritional factors.[2] The start of physical anthropometry can most probably be attributed to the increased interest in racial classification which entails measurement of the human body dimensions.[3],[4] Cephalometry is a branch of anthropometry that is largely confined to human head measurements.[3] It is made up of two indexes which are the cephalic (cranial) and the prosopic (facial) indexes. These indexes are important parameters, useful in anthropological studies for ascertaining variations.[2]
Cephalometry is a useful tool in individual identification and it is also useful to cosmetic surgeons during the process of facial reconstructive surgery.[2] It also helps by giving a baseline data which can be taken into consideration when designing facial equipment such as goggles and masks.[5]
Although studies of this type have been carried out in neighbouring ethnic groups,[6],[7] no such study, to the best of our knowledge has been carried out on the Ukwuani ethnic group in Delta State, Nigeria.
The major aim of this research was therefore to study the head and face forms of the Ukwuani indigenes of Delta State and create a baseline data which would be useful in future researches.
| Materials and Methods | | |
The Ukwuani and Aboh ethnic groups make the Ndokwa of today and together they inhabit the area of the Niger Delta approximately lying within longitude 6°6' and 6°41'.[8]
Both groups inhabit Ukwuani, Ndokwa West and Ndokwa East Local Government Areas of Delta State in Nigeria, with the Ukwuani being the larger of both ethnic groups and inhabiting the first two local government areas, i.e. Ukwuani and Ndokwa West.[9]
Although the Ukwuani people can be found in parts of both delta and rivers states of Nigeria, the Ukwuani in this contest are those solely of delta state origin.
In this study, 315 volunteered subjects (165 male and 150 female) who are indigenes of Ukwuani and Ndokwa West Local Government Areas of Delta State were selected randomly. They were confirmed to be from the Ukwuani ethnic group by both their parents and their grandparents. Their ages ranged from 18 to 30 years. Subjects with facial or cranial deformities and subjects with hairstyles who did not allow for effective measurement were excluded from the survey. Measurements were taken with the subjects sitting down in a relaxed mood and with his head in an anatomical position. Careful palpations were ensured before measurements were carried out. The following measurements were taken:
- Cranial length – Glabella to inion
- Cranial breadth – Distance between parietal eminences
- Facial length – Nasion to gnathion
- Facial breadth – Distance between zygomatic arches.
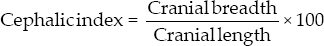
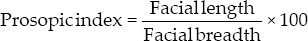
The cephalic and prosopic index were calculated based on the International Anatomical Descriptions.[2] By this, the respective indexes were given by the following formulas:
The cephalic and prosopic indexes were grouped according to the anatomical basis of facial and cranial phenotyping [Table 1] and [Table 2].[5]
Statistical analysis was carried out on the data using the IBM Corp, IBM SPSS Statistics for Windows, Version 20.0. Armonk, NY:IBM Corp and included frequencies and percentages. T-test was used to test for any statistical differences.
| Results | | |
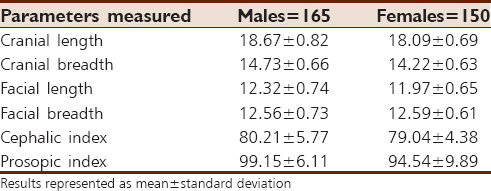
Results showed the mean cephalic indexes for males and females to be 80.21 ± 5.77 and 79.04 ± 4.38, respectively, and the mean prosopic indexes to be 99.15 ± 6.11 and 94.54 ± 9.89 with males having larger values for both indexes. A statistically significant difference was observed between male and female cephalic indexes (P = 0.01), but this was not the case between the male and female prosopic indexes (P = 0.25), using a 95% confidence interval [Table 3].
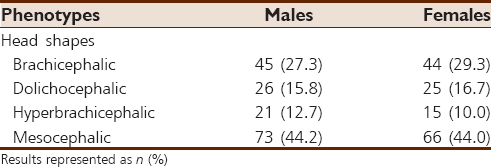
Based on the cephalic phenotypes, results showed that the population was majorly mesocephalic with 44.2% and 44% of males and females having that head shape and the least occurring head shape being the hyperbrachicephalic head with 12.7% and 10% of males and females having that shape [Table 4].
Prosopic phenotypes showed a largely hyperleptoprosopic population with 75.2% and 43.3% of males and females having this face type and the rarest type being the hypereuryprosopic face type with 0% and 0.7% occurrence in males and females [Table 5].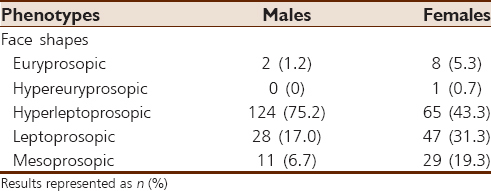 | Table 5: Distribution of head and face shapes among the study population
Click here to view |
| Discussion | | |
Anthropometric studies on cephalic and prosopic indexes have shown that most Africans, Indians, Australians, North Americans, and Central Europeans have the dolicocephalic head form, whereas people from the Middle East have the mesocephalic head form.[2],[10],[11]
In the present study, the mean cephalic index for males and females was 80.21 ± 5.77 and 79.04 ± 4.38, respectively. The results from our study differed from those of other studies among other ethnic groups. Indigenes of Maiduguri Northern Nigeria had an index of 71.90 and 73.92 for males and females, respectively,[2] among the Ogbia tribe of Bayelsa State, it was 73.68 and 72.24,[12] Urhobos had an index of 78.04, Edos 78.21 and Ibos were reported to have an index of 77.63.[6] Indians had a mean cephalic index of 72.64 and 72.06 for males and females,[13] in Northern Brazil, it was 80.93 and in Southern Brazil, the index was 79.68,[14] Iranians had an index of 84.80,[15] whereas South Africans were reported to have an index of 80.29.[16]
The most common head shape observed in this study was the mesocephalic head shape. This result buttresses the thought that variation occurs with regards to cranial phenotypic distribution among various populations. Studies among the Ogbia tribe of Bayelsa showed the population to be majorly dolicocephalic,[12] Indians were also reported to be mostly dolicocephalic [13] while Brazilians, Iranians, and South Africans were brachicephalic.[14],[15],[16]
Our results, however, agreed with the results of studies on the Urhobos, Edos, and Ijaws, all of which were mesocephalic.[6]
With regards to facial indexes, the mean facial index of the male and females population was 99.15 ± 6.11 and 94.54 ± 9.89, respectively. These values showed some degree of variations from values of indexes from other tribes. Studies among the Fars and Turkman in Iran showed their prosopic index to be 74.3 and 81.6, respectively,[17] Bini people of Nigeria had 86.93,[18] Indian males and females had an index of 87.19 and 86.75, respectively, whereas Malaysian males and females had indexes of 85.72 and 87.91, respectively.[19]
Our results, however, fell within the same range with results of indigenes of Maiduguri whose prosopic indexes were 99.59 and 97.54 for males and females, respectively.[2]
The most common facial type among the Ukwuani indigenes in this present study was the hyperleptoprosopic type, and this also proved the theory of variations in facial phenotypic ratios among ethnic groups. Indians and Malaysians were shown to be mesoprosopic,[19] whereas the Fars group in Iran were shown to be hypereuriprosopic.[15]
This study has investigated the cephalic and prosopic indexes of the Ukwuanis in Delta State and has determined the most dominant cranial and facial forms among males and females within this ethnic group. The study has also shown that a statistically significant difference exists between the cephalic indexes of males and females, but none exists between their respective prosopic indexes.
Data gotten from this study can serve as a baseline for anthropologists, aid in local anthropometric evaluations, and serve as a baseline line with which comparisons can be made between the Ukwuani and other ethnic groups.
Financial support and sponsorship
Nil.
Conflicts of interest
There are no conflicts of interest.
| References | | |
| 1. | Argyropoulos E, Sassouni V. Comparison of the dentofacial patterns for native Greek and American-caucasian adolescents. Am J Orthod Dentofacial Orthop 1989;95:238-49.  |
| 2. | Raji JM, Garba SH, Numan AI, Waziri MA, Maina MB. Morphological evaluation of head and face shapes in a North-Eastern Nigerian population. Aust J Basic Appl Sci 2010;4 Suppl 8:3338-41. |
| 3. | Meibodi EM, Mastari FR. Study of normal range of anatomical dimensions of one day old newborns by cephalometry. J Med Counc Islam Repub Iran 1996;14:1-8. |
| 4. | Heidari Z, Mahmoudzadeh-Sagheb H, Mohamadi M, Noori Mugahi MH, Arab A. Cephalic and proscopic indices: Comparison in one-day newborn boys in Zahedan. J Fac Med 2004;62:156-65. |
| 5. | Williams PL, Bannister LH, Berry MM, Collins P, Dyson M, Dussak JE, et al. Gray's Anatomy: Skeletal System. 38 th ed. Philadelphia: Churchill Livingstone; 1995. p. 607-12. |
| 6. | Odokuma EI, Igbigbi PS, Akpuaka FC, Esibenu UB. Craniometric patterns of three Nigerian ethnic groups. Afr J Biotechnol 2010;9 Suppl 10:1510-3. |
| 7. | Oladipo GS, Olotu J. Anthropometric comparison of cephalic indices between the Ijaw and Igbo tribes. Glob J Pure Appl Sci 2006;12 Suppl 1:137-8. |
| 8. | Ojieh C. The Ukwuani and their neighbours in precolonial times. Benue Val J Humanit 2003;5 Suppl 2:87-94. |
| 9. | Ojieh CO. The Ukwuani and the Europeans: A study in European aggression and African resistance. In: Egonwa OD (ed.) Abraka studies in African arts II: The humanities and human capital development. Ababa Press, Ibadan; 2011. p. 475-86. |
| 10. | Chamella M. Biological Anthropology. Translated to Persian (Farsi) by Nadri A. 1 st ed. Tehran: Gostar Publisher; 1997. p. 75. |
| 11. | Golalipour MJ, Haidari K, Jahanshahi M, Frahani MR. The shapes of head and face in normal male newborns in South-East of Caspian Sea (Iran-Gorgan). J Anat Soc India 2003;52:28-31. |
| 12. | Eroje MA, Fawehinmi HB, Jaja BN, Yaakor I. Cephalic index of Ogbia tribe of Bayelsa State. Int J Morphol 2010;28 Suppl 2:389-92. |
| 13. | Rajlakshmi CH, Singh MS, Bidhumukhi TH, Singh LC. Cephalic index of foetuses of Manipuri population – A baseline study. J Anat Soc India 2001;50:13-6. |
| 14. | Alves HA, Santos MI, Melo FC, Wellington R. Comparative study of the cephalic index of the population from the regions of the North and South Brazil. Int J Morphol 2011;29 Suppl 4:1370-4. |
| 15. | Golalipour MJ. The variation of head shapes in 17-20 years old native Fars male in Gorgan-North of Iran. Int J Morphol 2006;24 Suppl 2:187-90. |
| 16. | Jordaan HV. Neonatal and maternal cranial form. S Afr Med J 1976;50:2064-8. |
| 17. | Golalipour MJ, Jahanshahi M, Haidari K. The variation of head and face shapes in female newborns in the South-East of the Caspian Sea (Iran-Gorgan). Eur J Anat 2005;9 Suppl 2:95-8. |
| 18. | Omotoso DR, Oludiran OO, Sakpa CL. Nasofacial anthropometry of adult bini tribe in Nigeria. Afr J Biomed Res 2011;14:219-21. |
| 19. | Shetti RV, Pai SR, Shena GK, Gupta C, Chentam P, Soumya. Study of prosopic (facial) index of Indian and Malaysian students. Int J Morphol 2011;29 Suppl 3:1018-22. |
[Table 1], [Table 2], [Table 3], [Table 4], [Table 5]
|


 Search Pubmed for