|
 
 |
|
ORIGINAL ARTICLE |
|
|
|
| Year : 2013 | Volume
: 19
| Issue : 2 | Page : 219-232 |
| |
Human leukocyte antigen alleles, genotypes and haplotypes frequencies in renal transplant donors and recipients from West Central India
Jaina S Patel1, Manisha M Patel1, Prakash G Koringa1, Tejas M Shah1, Amrutlal K Patel1, Ajai K Tripathi1, Anila Mathew2, Mohan M Rajapurkar2, Chaitanya G Joshi1
1 Department of Animal Biotechnology, College of Veterinary Science and Animal Husbandry, Anand Agricultural University, Anand, Gujarat, India
2 Department of Nephrology, Muljibhai Patel Urological Hospital, Nadiad, Gujarat, India
| Date of Web Publication | 5-Aug-2013 |
Correspondence Address:
Chaitanya G Joshi
Department of Animal Biotechnology, College of Veterinary Science and Animal Husbandry, Anand Agricultural University, Anand - 388 001, Gujarat
India
 Source of Support: None, Conflict of Interest: None  | 1 |
DOI: 10.4103/0971-6866.116122

 Abstract Abstract | | |
Background: Human leukocyte antigen (HLA) is comprised of a highly polymorphic set of genes which determines the histocompatibility of organ transplantation. The present study was undertaken to identify HLA class I and class II allele, genotype and haplotype frequencies in renal transplant recipients and donors from West Central India.
Materials and Methods: HLA typing was carried out using Polymerase Chain Reaction-Sequence Specific Primer in 552 live related and unrelated renal transplant recipients and donors.
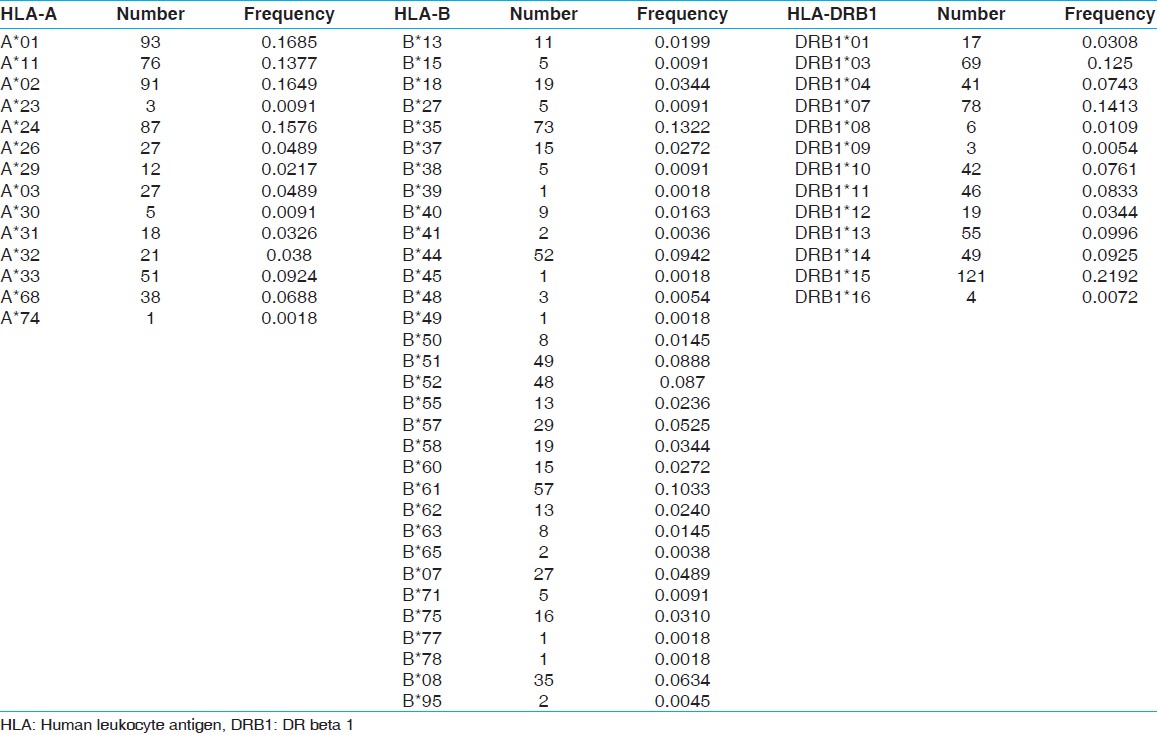
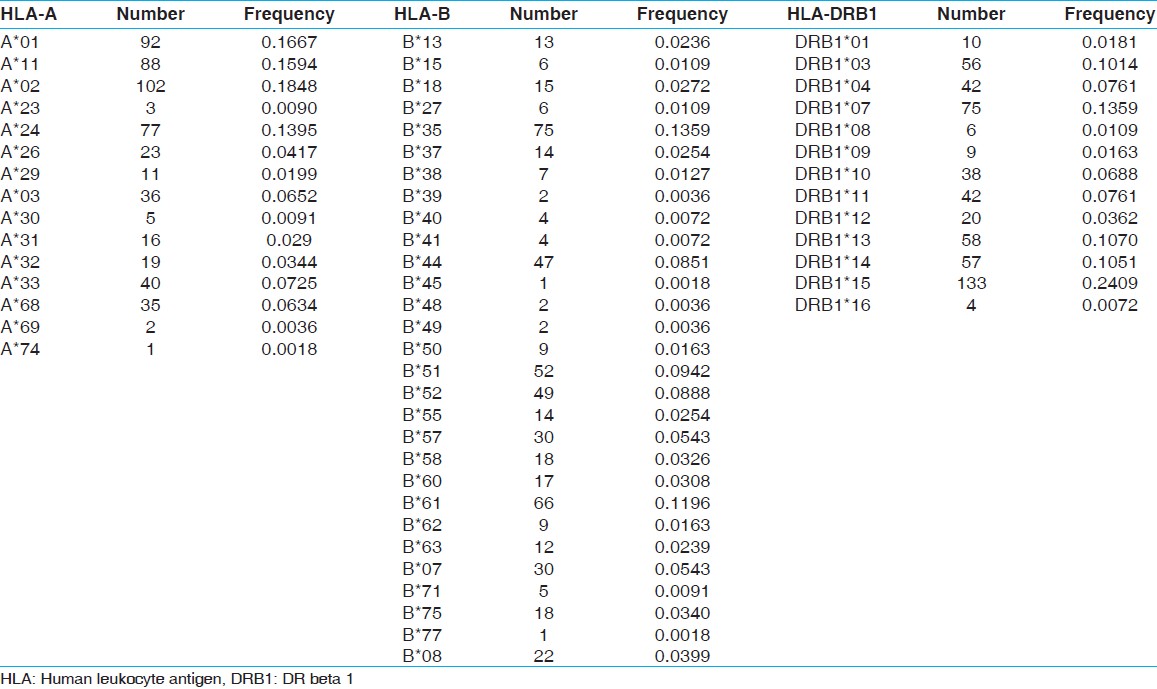
Results: The most frequent HLA class I and class II alleles and their frequencies in recipients were HLA-A*01 (0.1685) and A*02 (0.1649), HLA-B*35 (0.1322), and HLA-DR beta 1 (DRB 1)*15 (0.2192), whereas in donors, these were HLA-A*02 (0.1848) and A*01 (0.1667), HLA-B*35 (0.1359), and HLA-DRB1*15 (0.2409). The two-locus haplotype statistical analysis revealed HLA-A*02-B61 as the most common haplotype with the frequency of 0.0487 and 0.0510 in recipients and donors, respectively. Further, among the three locus haplotypes HLA-A*33-B*44-DRB1*07 and HLA-A*02-B*61-DRB1*15 were the most common haplotypes with frequencies 0.0362 and 0.0326, respectively in recipients and 0.0236 and 0.0323, respectively in donors. Genotype frequency revealed a high prevalence of genotype HLA-A*02/A*24 in recipients (0.058) compared to donors (0.0109) whereas low prevalence of HLA-A*01/A*02 in recipients (0.0435) than in donors (0.0797). The phylogenetic and principal component analysis of HLA allele and haplotype frequency distribution revealed genetic similarities of various ethnic groups. Further, case control analysis provides preliminary evidence of association of HLA-A genotype ( P < 0.05) with renal failure.
Conclusion: This study will be helpful in suitable donor search besides providing valuable information for population genetics and HLA disease association analysis.
Keywords: Allele, genotype, haplotype, human leukocyte antigens frequencies, polymorphism, renal transplant
How to cite this article:
Patel JS, Patel MM, Koringa PG, Shah TM, Patel AK, Tripathi AK, Mathew A, Rajapurkar MM, Joshi CG. Human leukocyte antigen alleles, genotypes and haplotypes frequencies in renal transplant donors and recipients from West Central India. Indian J Hum Genet 2013;19:219-32 |
How to cite this URL:
Patel JS, Patel MM, Koringa PG, Shah TM, Patel AK, Tripathi AK, Mathew A, Rajapurkar MM, Joshi CG. Human leukocyte antigen alleles, genotypes and haplotypes frequencies in renal transplant donors and recipients from West Central India. Indian J Hum Genet [serial online] 2013 [cited 2016 May 24];19:219-32. Available from: http://www.ijhg.com/text.asp?2013/19/2/219/116122 |
| Introduction | |  |
Renal transplant is the most common and standard therapy in case of renal failure. The success of transplantation largely depends on the compatibility of human leukocyte antigens (HLA). [1] HLA is also known as the main histocompatibility complex, which is encoded by highly polymorphic set of genes located on the short arm of chromosome 6 (Chr 6p21.1-6p21.3), [2] and play a key role in the immune system. HLA comprises two main groups; class I antigens (HLA-A, -B, -C) and class II antigens (HLA-DR, -DQ, -DP) which forms key determinants of histocompatibility. The HLA system is the most polymorphic and shows the greatest degree of polymorphism among all expressed loci in the human genome. [3],[4] The polymorphic nature, tight linkage among the loci and non-random association of alleles makes HLA an engaging candidate for population genetics study.
HLA allele frequency distribution in the population may be used to study disease associations, origin and genetic relationship among the population and to identify useful epitopes for molecular vaccines. [5] Clinically, HLA typing is a standard practice to identify compatible donors for solid organ and bone marrow transplantation. The association of various diseases with HLA alleles has been well-established. [6] The varying frequencies of the alleles in different populations worldwide may account to some extent, for increased resistance or susceptibility to diseases. Such information is helpful in identifying differences that may lead to a better understanding of disease mechanisms. [7],[8] The interaction between antigenic epitopes and the host immune system varies with the HLA alleles involved. This information is useful in selecting appropriate epitopes for inclusion in molecular vaccines and subsequently determining the efficacy of these vaccines in a particular population. [9] The HLA locus is also useful in determining the origin, migration and relationships between populations. [10]
In view of this, the present study was conducted to establish the frequencies of HLA class I and class II alleles, genotypes and haplotypes in 552 renal transplant recipients and donors from West Central India (WCI), to characterize their frequency distribution and disease association and compare with the world population to study genetic similarities among different populations.
| Materials and Methods | | |
Sample collection
Five to ten ml of venous blood samples were collected in Ethylenediaminetetraacetic acid (EDTA) vials with the consent of 552 individuals comprising of 276 renal transplant recipients and their prospective live related and unrelated donors from the west-central India and stored at 4°C.
HLA typing
The DNA from each blood sample was isolated using the method described by John, Weitzner. [11] The purity and concentration of the DNA was estimated using NanoDrop1000 spectrophotometer (Thermo scientific). All DNA samples were stored at −20°C until tested. HLA typing for HLA A, B, DRB1, DRB3, DRB4 and DRB5 alleles was carried out using Polymerase Chain Reaction-Sequence Specific Primer (PCR-SSP) (Micro SSP TM Generic HLA Class I and Class II ABDR DNA Typing Tray, One Lambda Inc., Canoga Park, CA). Interpretation of the results was carried out using the worksheets provided by the manufacturer.
Statistical analysis
Statistical analysis was carried out using MP Genomics 4 software (SAS Institute Inc. USA). All loci were tested individually for Hardy-Weinberg equilibrium (HWE) and linkage disequilibrium (LD) between the loci, and the statistical significance was determined using the Chi-square test. HWE and LD analysis, alleles, haplotypes and genotypes frequency analysis, principal component analysis (PCA) and case control association analysis were performed by JMP Genomics 4 software. Case control association analysis was based on Trend tests statistics. [12] The phylogenetic trees were constructed by neighbor-joining method using phylogeny inference package PHYLIP version 3.6 [13] with bootstra P value 100.
| Results | | |
HLA-A,-B and DRB1 allelic frequencies in renal transplant recipient and donors
Fourteen HLA-A, 32 HLA-B and 13 HLA-DRB1 alleles were detected among recipients [Table 1] whereas 15 HLA-A, 29 HLA-B and 13 HLA-DRB1 alleles were detected among donors [Table 2]. The most frequent HLA-A alleles were HLA-A*01 (0.1685), HLA-A*02 (0.1649) and HLA-A*24 (0.1576), HLA-B alleles were HLA-B*35 (0.1322), HLA-B*61 (0.1033) and HLA-B*44 (0.0942) and HLA-DRB1 alleles were DRB1*15 (0.2192), DRB1*07 (0.1413) and DRB1*03 (0.1250) among recipients whereas the most frequent HLA-A alleles were HLA-A*02 (0.1848), HLA-A*01 (0.1667) and HLA-A*11 (0.1594), HLA-B alleles were HLA-B*35 (0.1359), HLA-B*61 (0.1196) and HLA-B*51 (0.0942) and HLA-DRB1 alleles were DRB1*15 (0.2409), DRB1*07 (0.1359) and DRB1*13 (0.1070) among donors [Table 3]. The HWE analysis revealed study population exists in genetic equilibrium for the HLA-A, HLA-B and HLA-DRB1 loci in donors whereas for HLA-A and HLA-B loci in recipients [Table 4]. The LD analysis revealed linkage between HLA-A and HLA-B, and HLA-B and HLA-DRB1 genotypes in donors as well as in recipients [Table 4].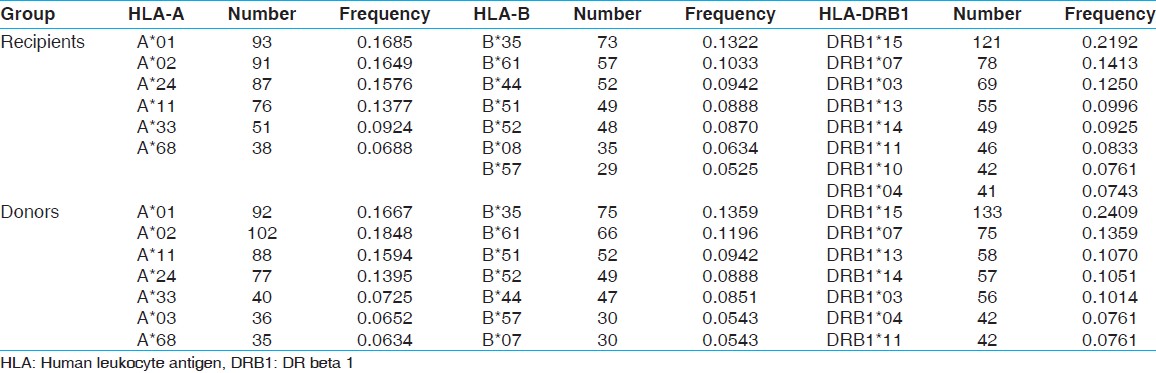 | Table 3: Allele frequency (>0.05) of recipients (n=276) and donors (n=276)
Click here to view |
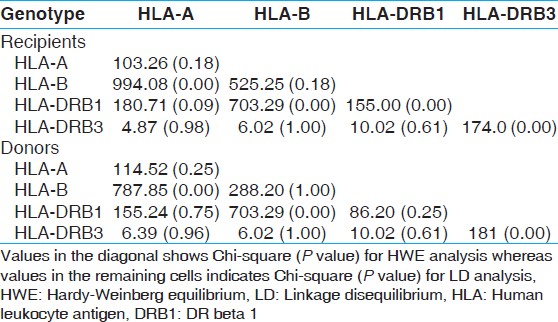 | Table 4: HWE and LD analysis of HLA frequencies in recipients and donors
Click here to view |
Most common HLA haplotype frequency in renal transplant recipient and donors
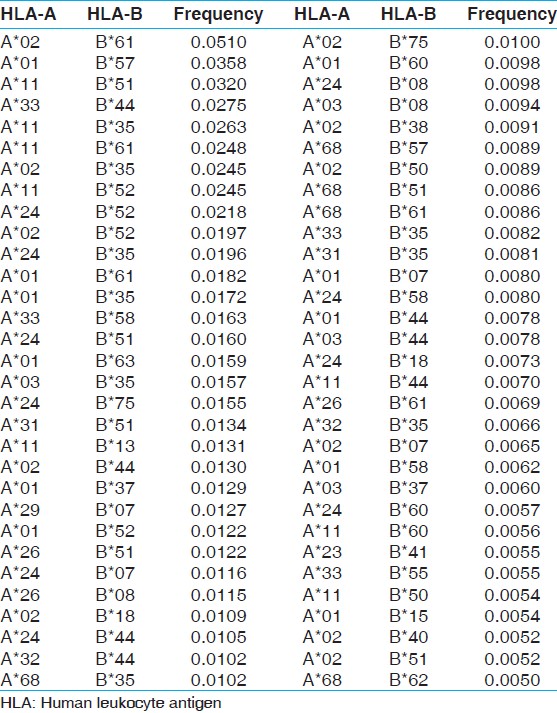
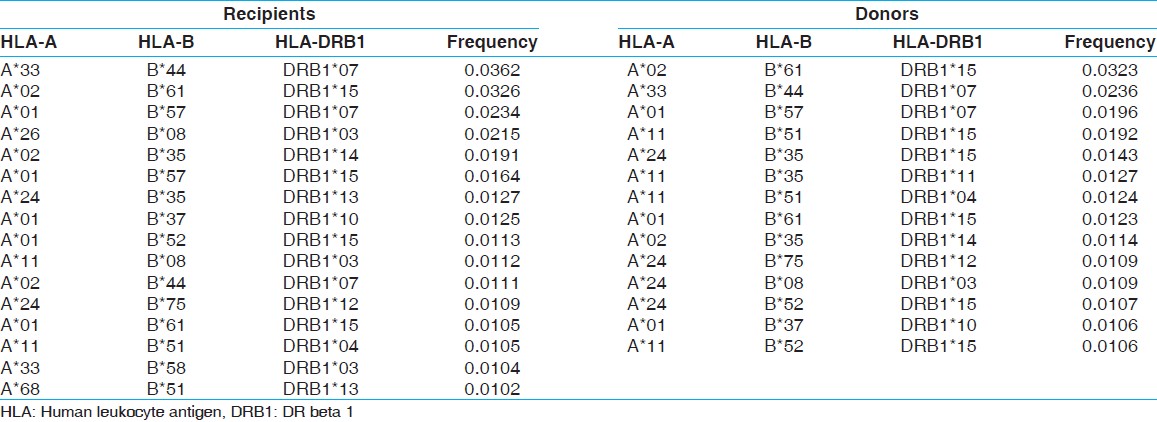
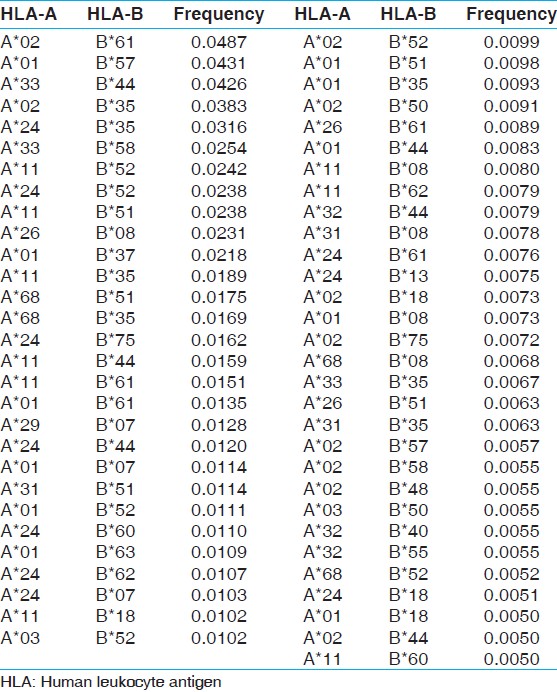
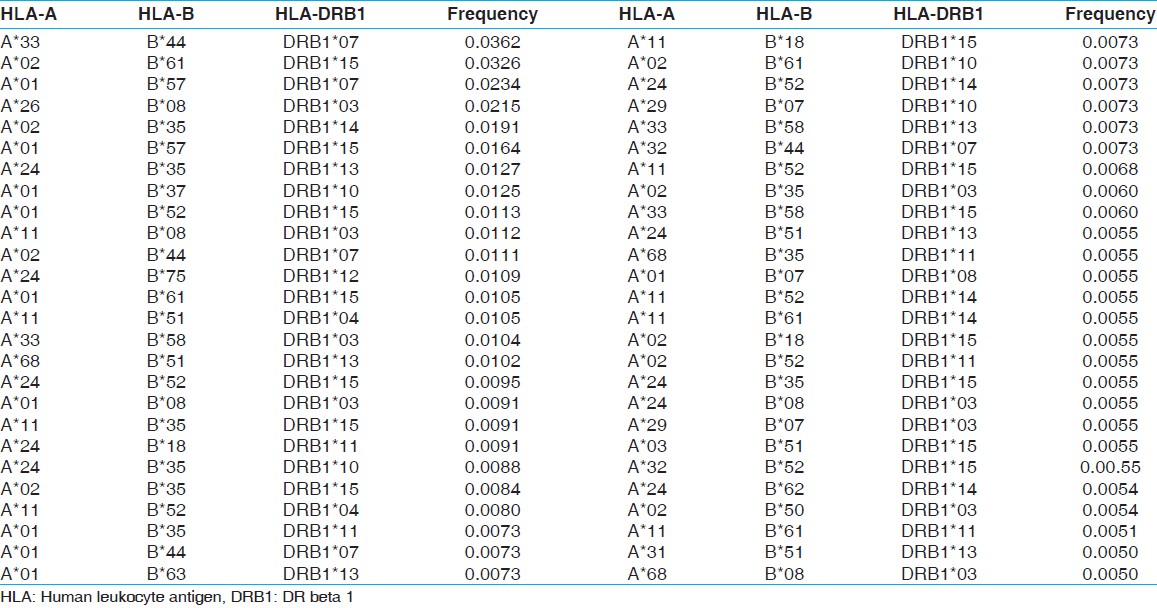
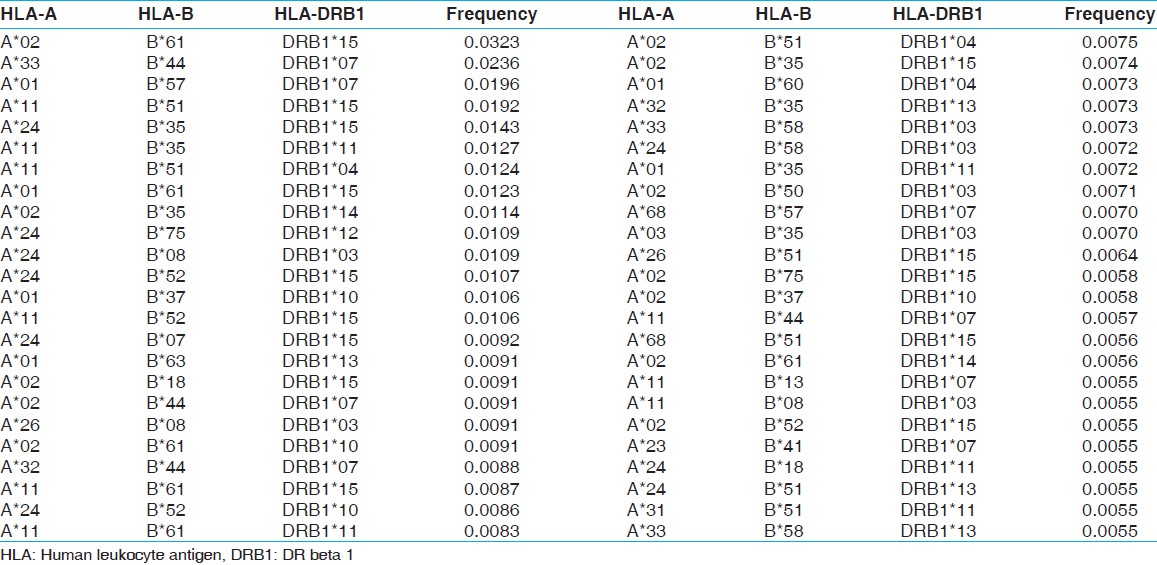
The two locus HLA-A-B haplotype analysis revealed A*02-B*61 and A*01-B*57 haplotypes as the most common haplotypes at a frequency of 0.0487 and 0.0431, respectively among recipients; and 0.0510 and 0.0358, respectively among donors [Table 5]. The three locus HLA-A-B-DRB1 haplotype analysis revealed A*33-B*44-DRB1*07 and A*02-B*61-DRB1*15 as the most common haplotypes at a frequency of 0.0362 and 0.0326, respectively among recipients; and 0.0323 and 0.0236, respectively among donors [Table 6]. At HLA DRB3, only two individuals were having DRB3*02 alleles, whereas at HLA-DRB4 and-DRB5 only one allele was recorded. The detail summary of the two and three locus haplotype frequencies in the recipient and donor population of the present study are given in [Table 7], [Table 8], [Table 9], [Table 10].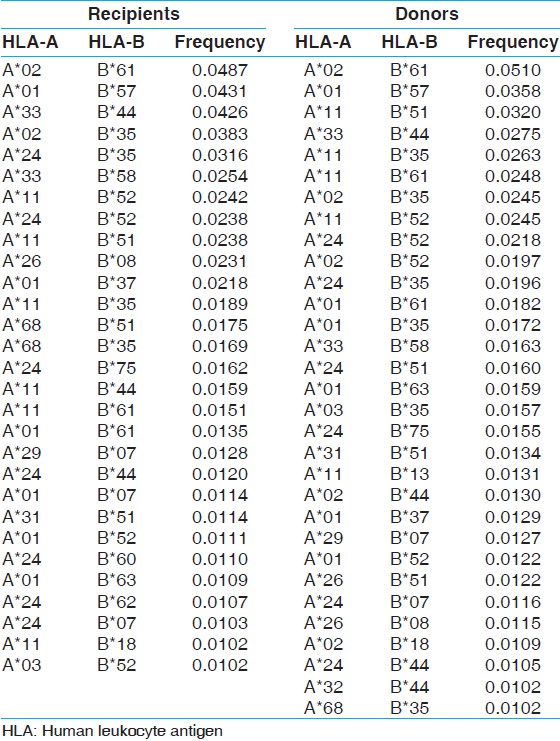 | Table 5: Two locus HLA-A and B haplotype frequency (>0.01) of renal transplant recipients and donors
Click here to view |
 | Table 6: Three locus HLA-A, B and DRB1 haplotype frequency (>0.01) of renal transplant recipients of western central India
Click here to view |
 | Table 7: HLA-A and B haplotype frequencies of renal transplant recipients
Click here to view |
 | Table 8: HLA-A, B and DRB1 haplotype frequencies of renal transplant recipients of western central India
Click here to view |
 | Table 10: HLA-A, B and DRB1 haplotype frequencies of renal transplant donors of western central India
Click here to view |
Most common HLA genotypes in renal transplant recipient and donors
There were 34 HLA-A genotypes, 32 HLA-B genotypes and 34 HLA-DRB1 genotypes in renal transplant recipients, whereas 32 HLA-A genotypes, 33 HLA-B genotypes and 36 HLA-DRB1 genotypes in renal transplant donors [Figure 1], [Figure 2], [Figure 3]. The genotypes revealing highest frequencies for HLA-A were A*11/*02, A*01/*24 and A*02/*24 [Figure 4]a and A*01/*02, A*11/*02 and A*01/*24 [Figure 4]b in recipients and donors, respectively. The genotypes with the highest frequency for HLA-B locus were B*44/*61, B*35/*52 and B*35/*61 [Figure 2]a and B*35/*51, B*35/*61, and B*44/*52 [Figure 2]b in recipients and donors, respectively; whereas for HLA-DRB1 locus were DRB1*15/*15, DRB1*07/*15 and DRB1*03/*10 [Figure 3]a and DRB1*13/*15, DRB1*14/*15 and DRB1*03/*15 [Figure 3]b in recipients and donors, respectively.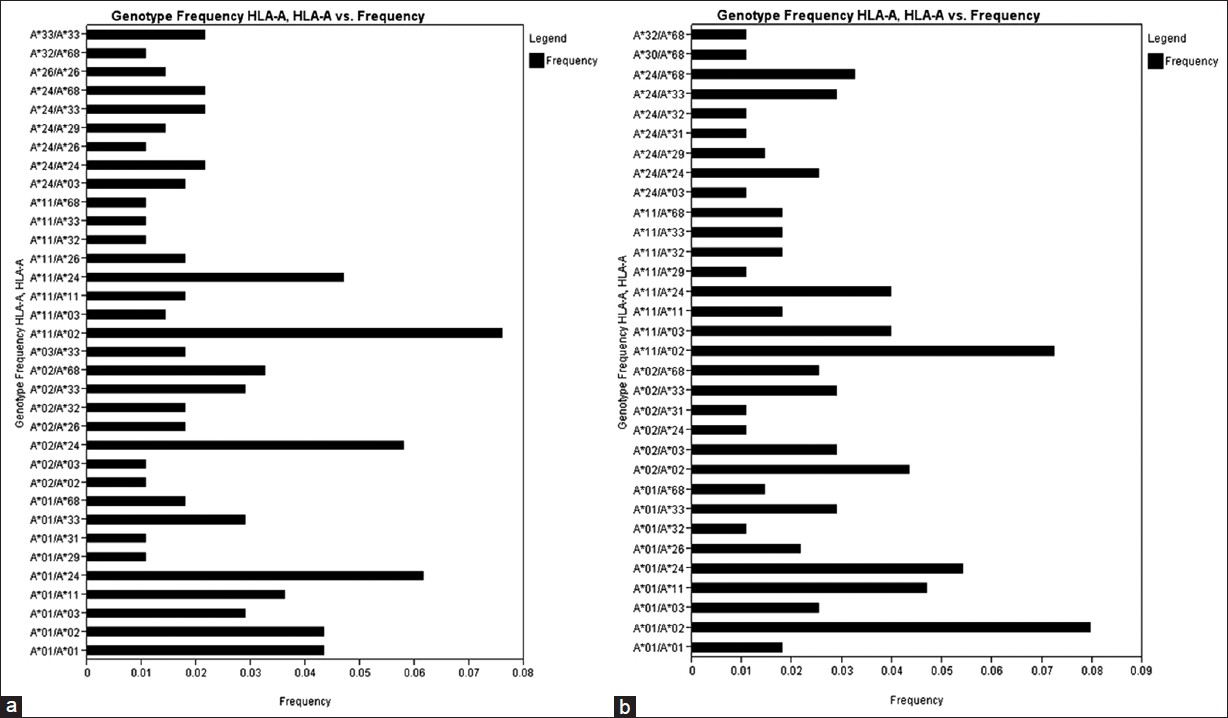 | Figure 1: Human leukocyte antigen - A genotype frequencies of renal transplant recipients (a) and donors (b)
Click here to view |
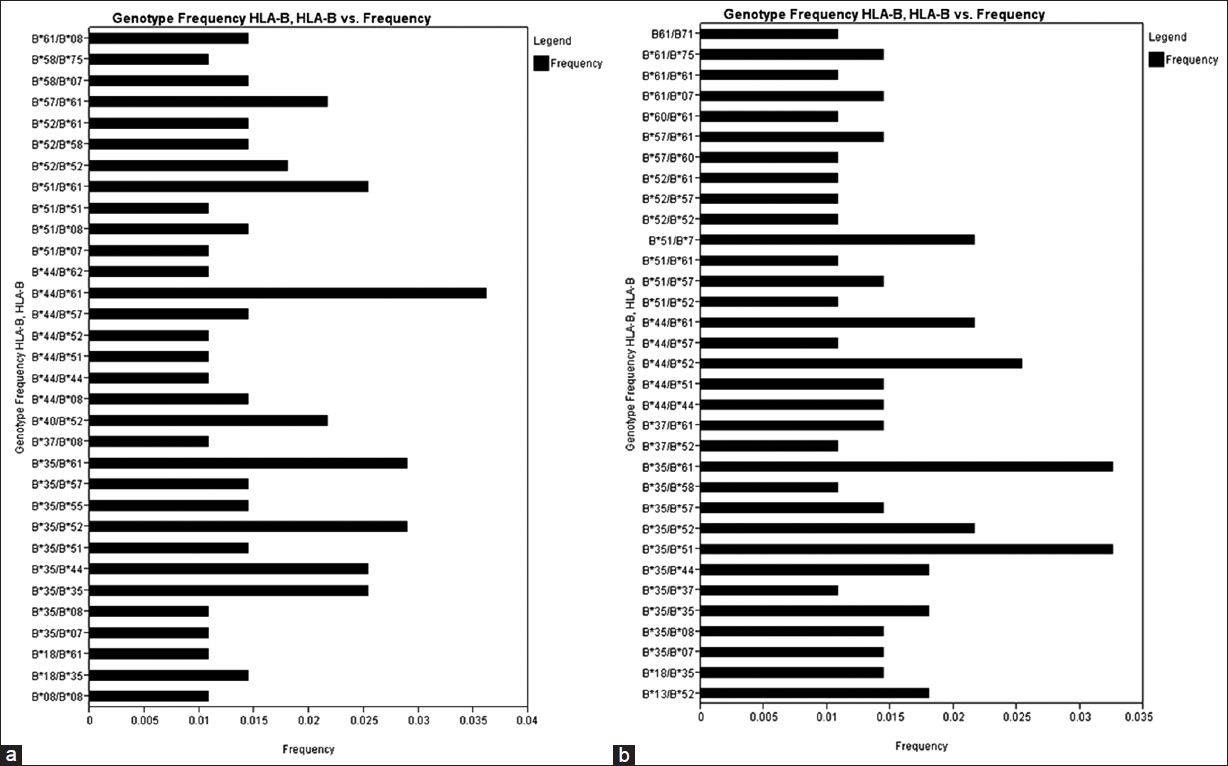 | Figure 2: Human leukocyte antigen - B genotype frequencies of renal transplant recipients (a) and donors (b)
Click here to view |
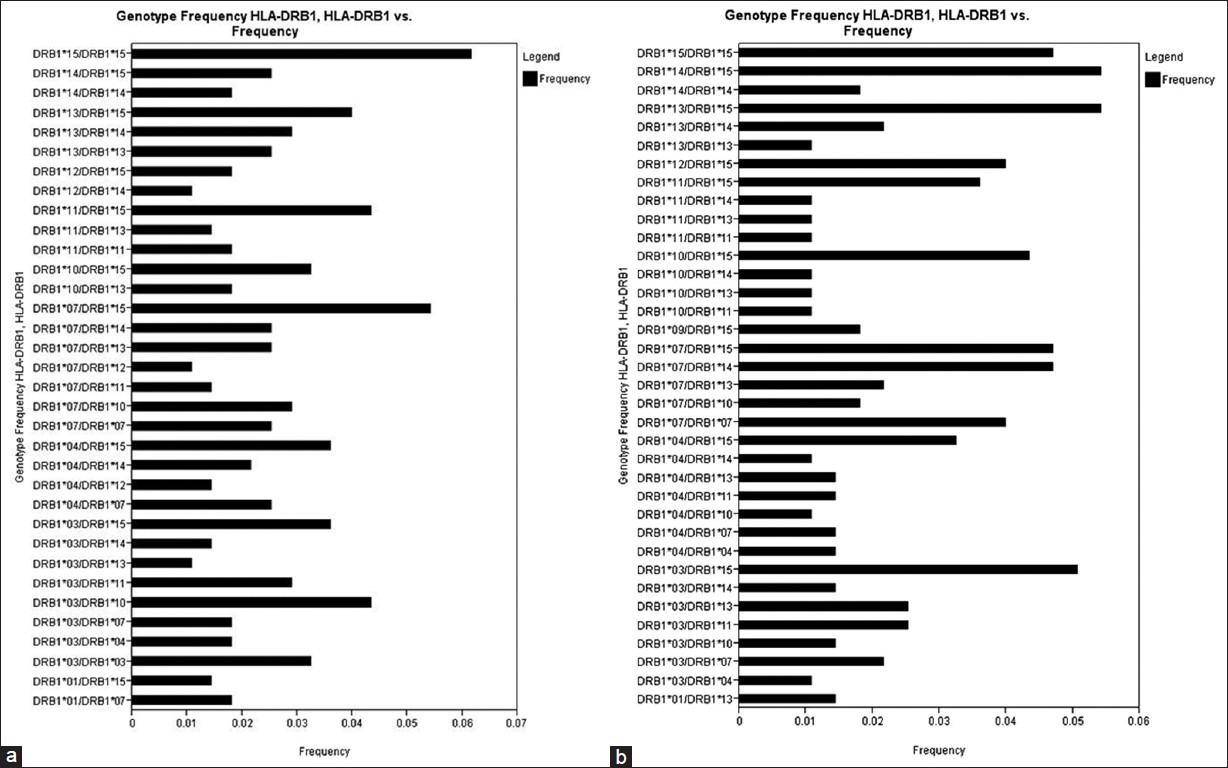 | Figure 3: Human leukocyte antigen - DRB1 genotype frequencies of renal transplant recipients (a) and (b) donors
Click here to view |
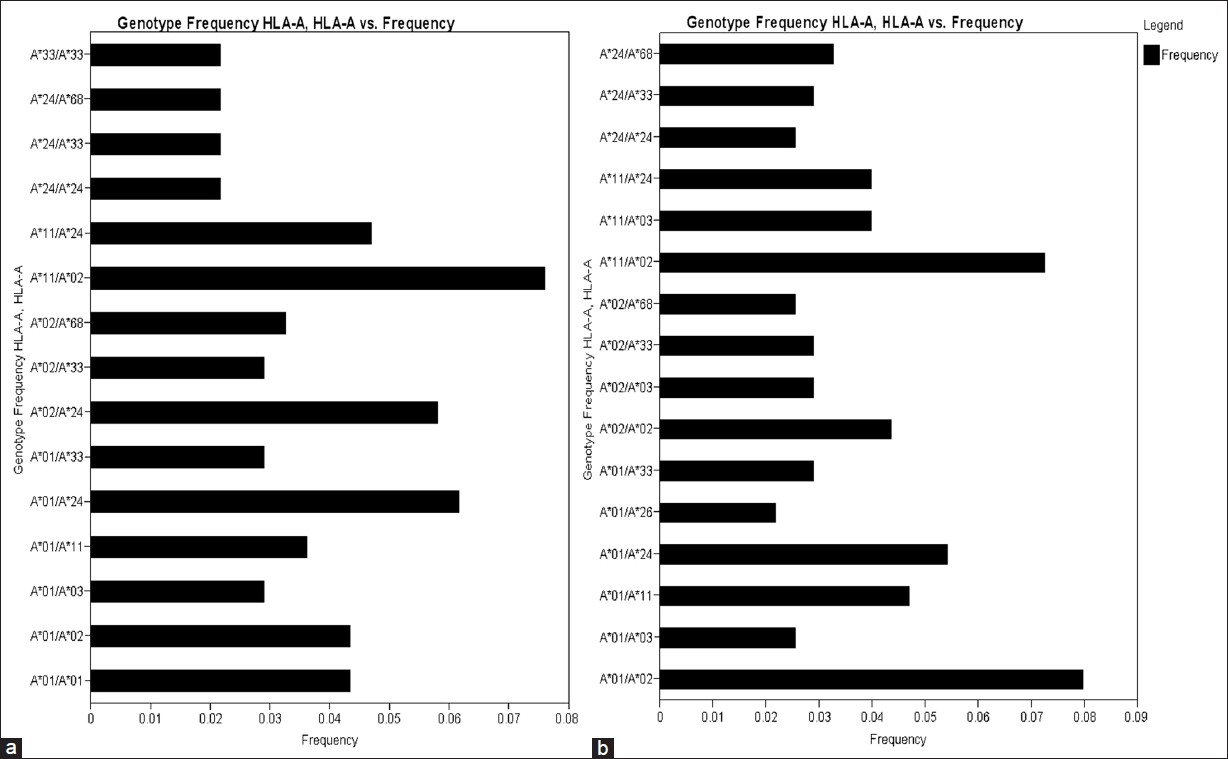 | Figure 4: Human leukocyte antigen (HLA) HLA-A/A genotype frequency ( > 0.02) of renal transplant recipients (a) and (b) donors
Click here to view |
Comparison of HLA allele and haplotype frequency distribution with world population
HLA allelic and haplotype frequencies of the present study were compared with other Indian populations and worldwide populations. The allelic frequencies of other ethnic groups were obtained from http://www.allelefrequencies.net. [14] The allele frequencies that tallied to 1 and typed by PCR-SSP or sequence based typing were only considered for comparison from different geographical regions. It was observed that the HLA-A*01 allelic frequency was higher in our recipients compared to other Indian populations, [14] whereas HLA-A*02 frequency was higher in our donors but lower than other world populations. When highest frequencies of recipients and donors compared with world population, HLA-A*01 frequency was highest in our population while that of HLA-A*02 was lowest in our population [Table 11]. For HLA-B locus, the HLA-B*35 allele frequency was highest in our population for both recipients and donors, than other Indian population. Allele HLA-B*60, B*61, B*62, B*63, B*71, B*75 and B*77 were found only in our recipient and donor samples while HLA-B*65, B*78 and B*95 were found only in recipients. When highest frequencies of recipients and donors were compared with world population, HLA-B*35 frequency was highest in Brazil mixed population [Table 12]. The HLA-DRB1*15 frequency was highest in our population from both recipients and donors, compared to other populations worldwide [Supplementary [Table 13].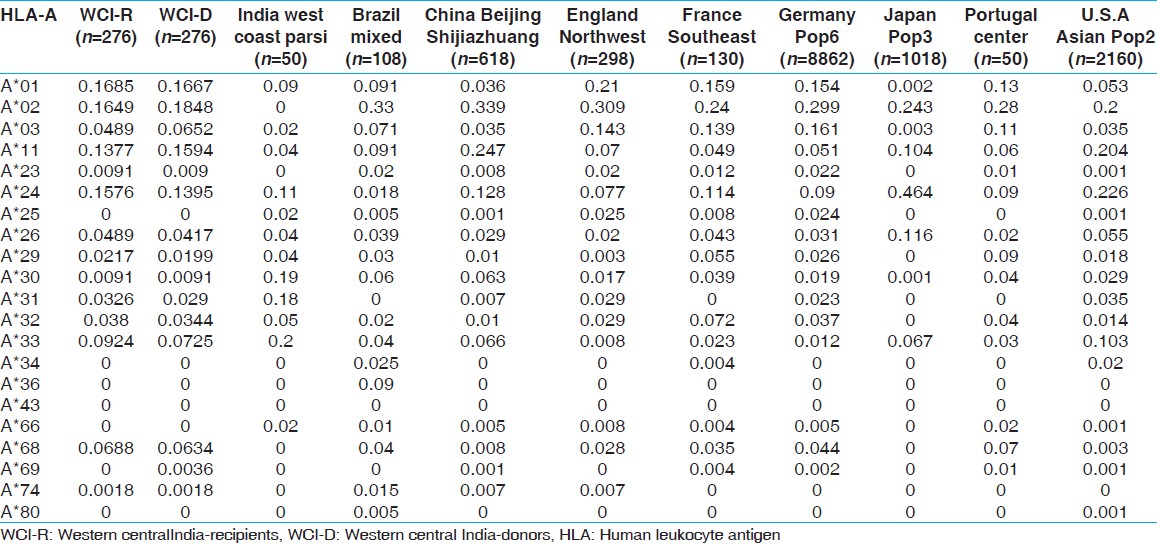 | Table 11: Allele frequencies of HLA-A locus in renal transplant recipients and donors of western-central India, other Indian and world population
Click here to view |
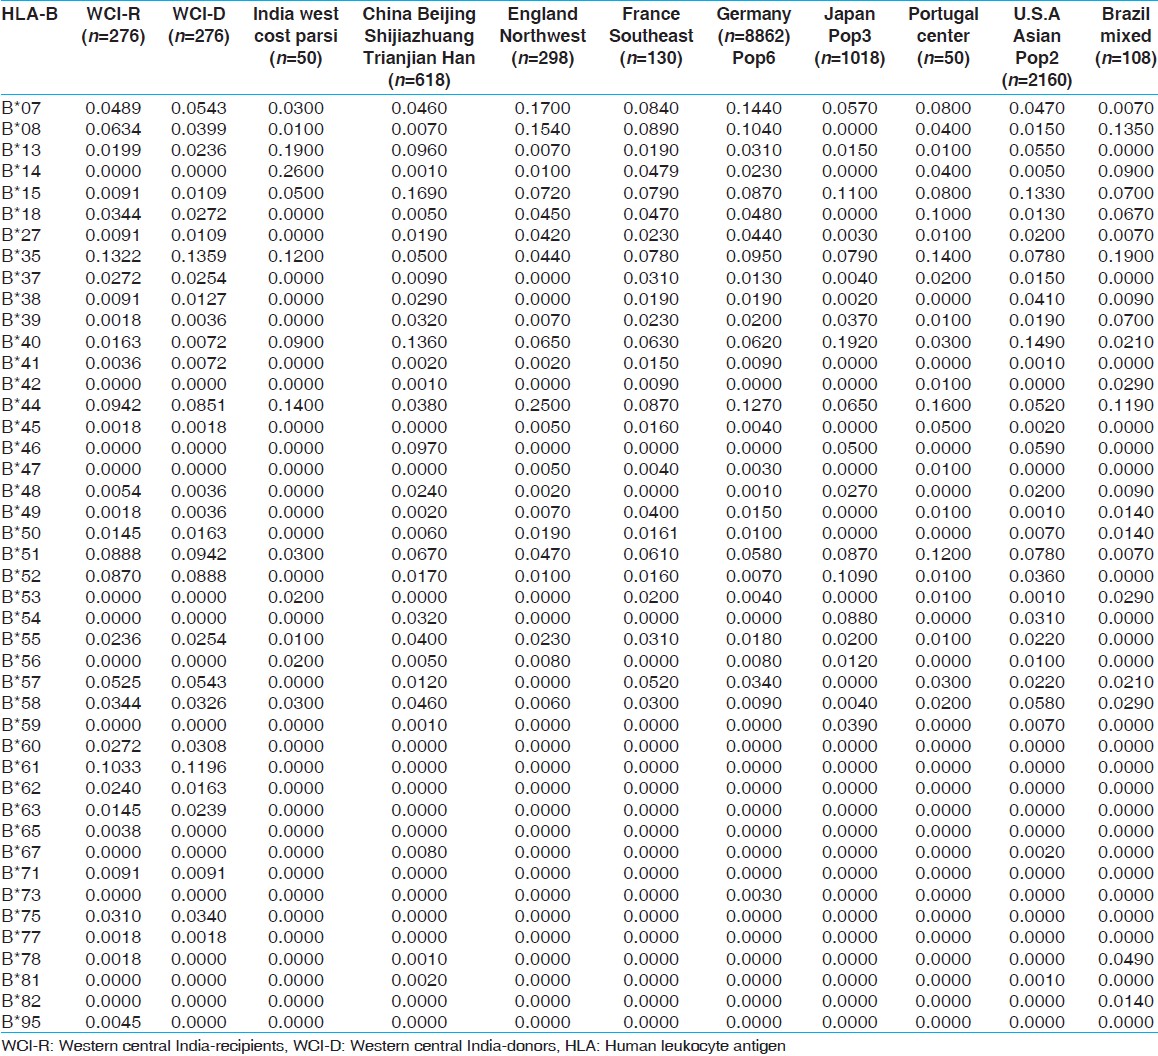 | Table 12: Allele frequencies of HLA-B locus in renal transplant recipients and donors of western-central India and other Indian and world population
Click here to view |
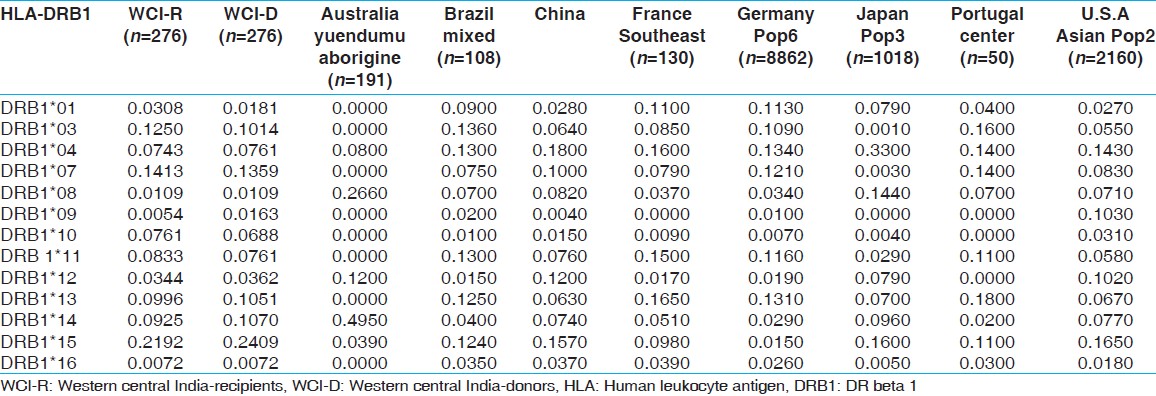 | Table 13: Allele frequencies of HLA-DRB1 locus in renal transplant recipients and donors of western-central India and other Indian and world population
Click here to view |
Phylogenetic tree analysis
The phylogenetic tree was constructed with the PHYLIP Software package by the Neighbor joining method using the allelic frequencies at HLA-A [Figure 5]a, -B [Figure 5]b, -DRB1 [Figure 5]c and all loci together [Figure 5]d in the West Central Indian population and other ethnic groups. The neighboring ethnic groups used in the phylogenetic tree construction were India west coast Parsi, Brazil mixed, China, England, France, Germany, Japan, Portugal, Australia and U.S.A. and our study population. The populations were included for clustering only if the frequency at a locus reached unity. The three major clusters of populations obtained based on HLA-A allelic frequencies were (1) The populations from West Central India-donor (WCI-D), U.S.An Asian and China, (2) those from France, England, Germany and (3) from India west Parsi, Brazil and Portugal. The WCI populations showed the closest genetic structure to the U.S.A, an Asian and Chinese populations. Two main clusters of populations were obtained based on HLA-B; the populations from (1) Portugal, Brazil, India, Parsi, and (2) France, Japan, China, U.S.A., an Asian, Germany and England. The WCI population showed equal genetic distance to the other populations. The two main clusters of populations obtained, based on HLA-DRB1 were the populations living in (1) U.S.A., an Asian, China, Japan, Australia, and (2) Portugal, Brazil, Germany and France. The WCI population showed the equal genetic structure to the other populations. When considered all loci (HLA-A, B and DRB1) together, the three main clusters of populations obtained were (1) from Japan, (2) from Portugal, U.S.A, an Asian, China, and (3) from Brazil, France and Germany. The WCI population first clustered with Japan and then other groups.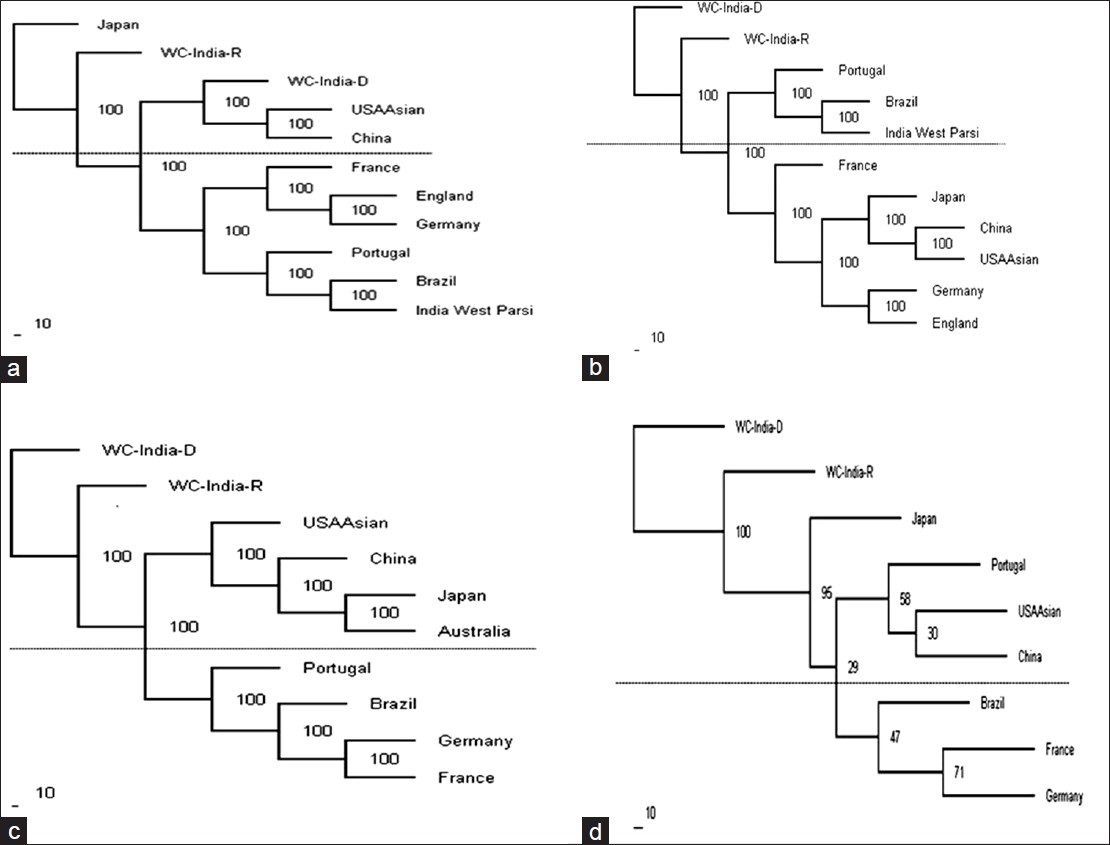 | Figure 5: Dendrogram constructed by the neighbor-joining method (a) relationships of the West Central India (WCI populations with other nine populations based on the allelic frequencies of human leukocyte antigen (HLA) HLA-A locus; (b) relationships of the WCI population with other 9 populations based on the allelic frequencies of HLA-B locus; (c) relationships of the WCI population with other 8 populations based on the allelic frequencies of HLA-DRB1 locus; and (d) relationships of the WCI population with other 7 populations based on the combined allelic frequencies of HLA-A, B and DRB1 loci
Click here to view |
PCA
To further investigate possible genetic relationships between these populations, we performed PCA of the genotypic frequencies of HLA-A,-B and-DRB1 loci which resulted in the clustering of nine populations into three groups. The total variance of 71.5% among all population could be explained by three principal components PCA1 (31.6%), PCA2 (25.9%) and PCA3 (14.0%) [Figure 6]. Japan, China and USA Asian formed one cluster whereas our populations West Central India-recipients and WCI-D clustered with European populations (i.e., Germany, France and Portugal). Brazilian population stood apart.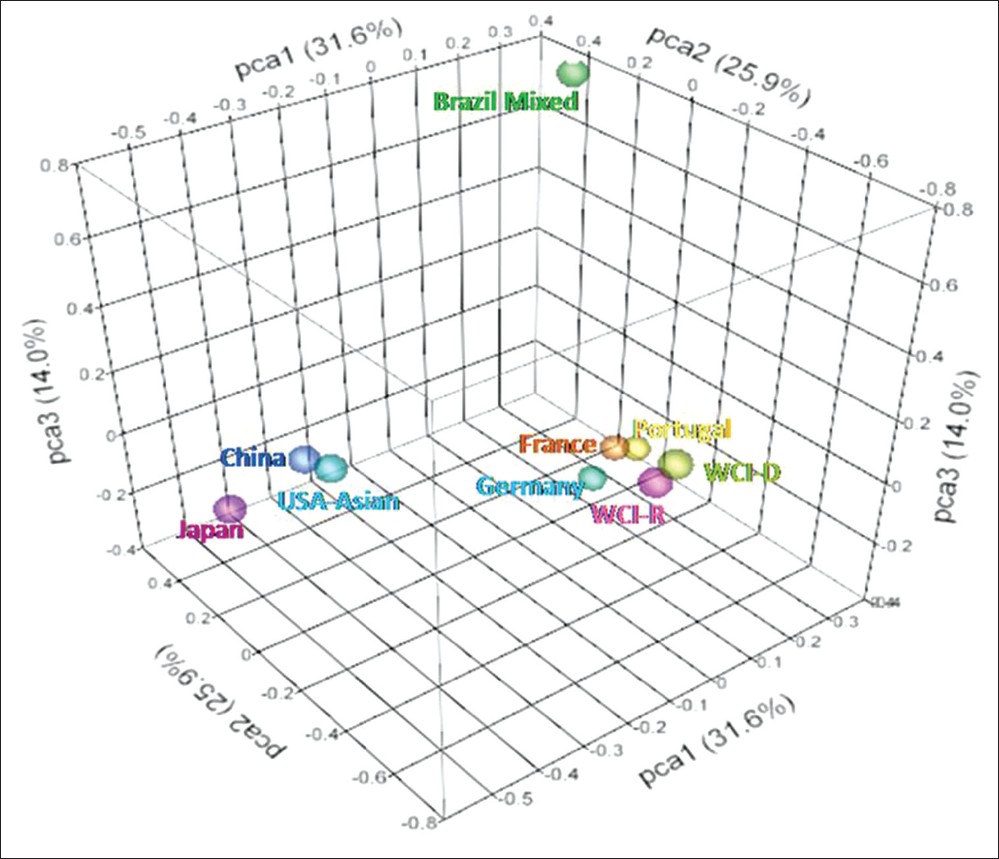 | Figure 6: Principal component analysis of genotypic frequencies of HLA-A,-B and-DRB1 loci. Total variance was partitioned in to three components. Three-dimensional scattered plot showing clustering of different populations into three groups
Click here to view |
Case control association analysis
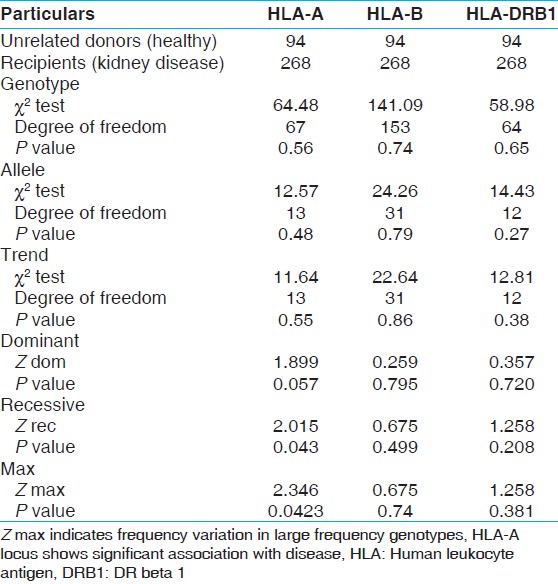
Further we studied the association between HLA and disease condition. Case control association analysis between unrelated healthy donors and kidney recipients [Table 14] showed that genotype, alleles or trend in HLA A, B, and DRB1 frequencies did not show any significant difference as revealed by Chi-square test. However, Z Recessive (P value 0.043) and Z Max (P value 0.042) showed significant association of HLA-A genotypes with disease. The frequency distribution analysis of the homozygous recessive alleles in recipient revealed significantly higher frequency of HLA A*01/A*01 and A*33/A*33 genotypes in recipients (4.36% and 2.18%, respectively) compared to unrelated healthy donors (1.06% and 0.00%, respectively). Z Max indicates frequency variation in large frequency genotype at HLA locus that is associated with disease. The analysis of large frequency genotypes revealed genotypes HLA-A*11/A*02, A*01/A*24, A*02/A*24, A*11/A*24, A*01/A*01, A*01/A*02 with 7.46, 5.97, 5.97, 4.85, 4.48 and 4.48% frequencies, respectively in recipients and 12.77, 5.32, 1.06, 3.19, 1.06, and 9.57% frequencies, respectively in unrelated healthy donors.
| Discussion | | |
This study describes the analysis of HLA antigen frequency distribution in kidney recipients and their prospective live related and unrelated donors from West-Central regions of India for the first time. The HLA frequency of the study population was compared with the frequency of the world population and genetic relationship between various populations were analyzed. Further, attempts were made to establish possible association of HLA alleles with kidney failure in renal transplant recipients.
In our study, the high frequency alleles in recipients and donors were HLA-A*01, *02, *24, *11; B*35, *61, *44, *51, *52; DRB1*15, *07, *03 and HLA-A*02, *01, *11, *24; B*35, *61, *51, *52, *44; DRB1*15, *07, *03, respectively. These results suggest that the frequency distribution of alleles in the recipient and donor population did not vary significantly, although relative occurrence of the alleles differed with in the groups. The two locus and three locus haplotype distribution revealed HLA-A*02-B*61, A*01-B*57, and HLA-A*33-B*44-DRB1*07, A*02-B*61-DRB1*15, as the common haplotypes in both donors as well as recipients population. However, the analysis of genotype frequency distribution in recipients and donors suggested, appreciable variation as frequency of genotype HLA-A*02/*24 was higher in recipient group (0.058) compared to donor group (0.0109). Similarly, the frequency of genotype HLA-A*01/*02 was low in recipient group (0.0435) compared to donor group (0.0797). When compared with the other Indian population, the allelic and haplotype frequency appeared to vary from the other Indian population from Maharashtra. [1] Similarly, when compared with the world population, the allelic frequency distribution varied between different ethnic groups. While we observed our study population in genetic equilibrium for HLA-A, HLA-B and HLA-DRB1 loci in donors and HLA-A and HLA-B loci in recipients, there exist genetic disequilibrium for HLA-DRB3 locus in donors and HLA-DRB1 and DRB3 loci in recipients. The linkage analysis suggested strong linkage between HLA-A and -B genotype as well as HLA-B and -DRB1 genotype but not between HLA-A and -DRB1 genotypes in both donors and recipients. This suggests there is high co-segregation of HLA-A and -B, and HLA-B and -DRB1 alleles but independent assortment of HLA-A and -DRB1 alleles.
The phylogenetic trees when constructed using HLA-A, B, DRB1 frequencies independently or pooled over all loci revealed that WCI populations belonged to the Asian populations and was most closely related to other Asian groups, than to European groups. The geographically separated populations are more likely to subject to selection in distinctive environments; [15] hence genetic distance fairly correlates with the geographic distance. Genetic distance here refers to the genetic divergence between populations within a species. Small genetic distance indicates a close genetic relationship between the two populations, whereas a large genetic distance indicates a distant genetic relationship. [16] USA Asian and China always clustered together indicating that USA Asian population consists largely of Chinese (immigrants). Parsis from Indian west coast is originally migrants from the Mediterranean hence it is natural that they may not cluster with Asian populations.
The phylogenetic tree cannot properly analyze the genetic relationship among the population as several populations can be derived from a single population. [17] PCA can be applied to overcome these problems as an alternative to phylogenetic trees. In our study, the PCA revealed clustering of WCI population with European populations, whereas Brazilian population was completely separated. Closeness of WCI with European population revealed by PCA analysis may be better indicative of lineage as the study population and European populations are believed to be the descendent of common ancestors.
The frequency distribution analysis of HLA alleles may provide significant insights into HLA disease association. [18],[19] In our study, the case control analysis between the unrelated healthy donors and recipients suggested no significant association of HLA alleles, genotypes or trends. However, Z Recessive and Z Max analysis suggested significant association of HLA-A genotype with kidney disease. Interestingly, HLA-A*01/A*01, and -A*33/A*33 genotypic frequencies were found to be significantly higher in recipients compared to unrelated donors. The presence of these genotypes in homozygous condition may predispose such individuals to renal disease. Further, distribution of large frequency genotypes (HLA-A*11/A*02, A*02/A*24, A*01/A*01, and A*01/A*02) were also varied significantly between recipients and unrelated donors suggesting their possible association with renal disease. The association of HLA antigens with the renal diseases has been poorly established. However, it is possible that specific HLA antigens may predispose an individual to other autoimmune or infectious diseases which affect the renal function. [20],[21],[22]
| Conclusion | | |
The present study analyzed genotype, allele, and haplotype frequency distribution in the renal transplant donors and recipients and its comparison with different populations worldwide. The information on HLA allelic distribution and genetic similarity between various populations will be useful to identify compatible donors within a specific ethnic group for patients requiring renal transplant. The HLA disease association study provides preliminary evidence of a possible association of HLA-A genotype with renal diseases. However, it also indicates the necessity for high resolution HLA genotyping to study association with the renal failure as well as to promote greater compatibility in the area of transplants. Nevertheless, the data generated in the present study represents an important source of information for investigators in the field of transplantation, HLA disease association and population genetics.
| Acknowledgement | | |
Authors are thankful to Dr. J. V. Solanki and Dr. A. E. Nivsarkar for their critical reading of the manuscript.
| References | | |
| 1. | Prasanavar D, Shankarkumar U. HLA: Antigen and haplotype frequencies in renal transplant recipients and donors of Maharashtra (Western India). Int J Hum Genet 2004;4:155-9. 
|
| 2. | Alper CA, Larsen CE, Dubey DP, Awdeh ZL, Fici DA, Yunis EJ. The haplotype structure of the human major histocompatibility complex. Hum Immunol 2006;67:73-84.
|
| 3. | Little AM, Parham P. Polymorphism and evolution of HLA class I and II genes and molecules. Rev Immunogenet 1999;1:105-23.
|
| 4. | Williams TM. Human leukocyte antigen gene polymorphism and the histocompatibility laboratory. J Mol Diagn 2001;3:98-104.
|
| 5. | Marsh SG, Parham P, Barber LD. The HLA Factsbook. London: Academic Press; 2000.
|
| 6. | Ryder LP, Svejgaard A, Dausset J. Genetics of HLA disease association. Annu Rev Genet 1981;15:169-87.
|
| 7. | Hirayama K, Zaidi AS, Lokman Hakim S, Kimura A, Ong KJ, Kikuchi M, et al. Molecular analysis of HLA-B in the Malaysian aborigines. Tissue Antigens 1996;48:692-7.
|
| 8. | Dhaliwal JS, Too CL, Lisut M, Lee YY, Murad S. HLA-B27 polymorphism in the Malays. Tissue Antigens 2003;62:330-2.
|
| 9. | Dawson DV, Ozgur M, Sari K, Ghanayem M, Kostyu DD. Ramifications of HLA class I polymorphism and population genetics for vaccine development. Genet Epidemiol 2001;20:87-106.
|
| 10. | Cavalli-Sforza L, Menozzi P, Piazza A. The History and Geography of Human Genes. New Jersey: Princeton University Press; 1994.
|
| 11. | John SW, Weitzner G, Rozen R, Scriver CR. A rapid procedure for extracting genomic DNA from leukocytes. Nucleic Acids Res 1991;19:408.
|
| 12. | Freidlin B, Zheng G, Li Z, Gastwirth JL. Trend tests for case-control studies of genetic markers: Power, sample size and robustness. Hum Hered 2002;53:146-52.
|
| 13. | Felsenstein J. PHYLIP (Phylogeny Inference Package) version 3.6. Distributed by the author. Seattle: Department of Genome Sciences: University of Washington; 2005.
|
| 14. | Gonzalez-Galarza FF, Christmas S, Middleton D, Jones AR. Allele frequency net: A database and online repository for immune gene frequencies in worldwide populations. Nucleic Acids Res 2011;39:D913-9.
|
| 15. | Ding K, Kullo IJ. Geographic differences in allele frequencies of susceptibility SNPs for cardiovascular disease. BMC Med Genet 2011;12:55.
|
| 16. | Hattemer HH. Genetic distance between populations. Theor Appl Genet 1982;62:219-23.
|
| 17. | Price AL, Patterson NJ, Plenge RM, Weinblatt ME, Shadick NA, Reich D. Principal components analysis corrects for stratification in genome-wide association studies. Nat Genet 2006;38:904-9.
|
| 18. | Bodmer WF. The HLA system: Structure and function. J Clin Pathol 1987;40:948-58.
|
| 19. | Bodmer JG, Marsh SG, Albert ED, Bodmer WF, Bontrop RE, Dupont B, et al. Nomenclature for factors of the HLA system, 1998. Tissue Antigens 1999;53:407-46.
|
| 20. | Stanescu HC, Arcos-Burgos M, Medlar A, Bockenhauer D, Kottgen A, Dragomirescu L, et al. Risk HLA-DQA1 and PLA (2) R1 alleles in idiopathic membranous nephropathy. N Engl J Med 2011;364:616-26.
|
| 21. | Feehally J, Farrall M, Boland A, Gale DP, Gut I, Heath S, et al. HLA has strongest association with IgA nephropathy in genome-wide analysis. J Am Soc Nephrol 2010;21:1791-7.
|
| 22. | Korva M, Saksida A, Kunilo S, Vidan Jeras B, Avsic-Zupanc T. HLA-associated hemorrhagic fever with renal syndrome disease progression in slovenian patients. Clin Vaccine Immunol 2011;18:1435-40.
|
[Figure 1], [Figure 2], [Figure 3], [Figure 4], [Figure 5], [Figure 6]
[Table 1], [Table 2], [Table 3], [Table 4], [Table 5], [Table 6], [Table 7], [Table 8], [Table 9], [Table 10], [Table 11], [Table 12], [Table 13], [Table 14]
| This article has been cited by | | 1 |
HLA-B*1502 is associated with carbamazepine induced Stevens–Johnson syndrome in North Indian population |
|
| Ritu Aggarwal,Madhulika Sharma,Manish Modi,Vivek kumar Garg,Manilla Salaria | | Human Immunology. 2014; 75(11): 1120 | | [Pubmed] | [DOI] | |
|
|
|
|