|
 
 |
|
ORIGINAL ARTICLE |
|
|
|
| Year : 2014 | Volume
: 20
| Issue : 2 | Page : 166-174 |
| |
Insertion-deletions burden in copy number polymorphisms of the Tibetan population
Avinash M Veerappa1, Sangeetha Vishweswaraiah1, Kusuma Lingaiah1, N Megha Murthy1, Raviraj V Suresh1, Keshava Belur1, Nallur B Ramachandra2, Tejaswini2, Niveditha B Patel2, PK Supriya Gowda2
1 Department of Neurology, JSS Hospital, Mysore, Karnataka, India
2 Department of Studies in Zoology, University of Mysore, Manasagangotri, Mysore, Karnataka, India
| Date of Web Publication | 14-Oct-2014 |
Correspondence Address:
Nallur B Ramachandra
Department of Studies in Zoology, Genetics and Genomics Lab, University of Mysore, Manasagangotri, Mysore, Karnataka
India
 Source of Support: None, Conflict of Interest: None
DOI: 10.4103/0971-6866.142888

 Abstract Abstract | | |
Background: Many studies have been conducted to identify either insertions-deletions (inDels) or copy number variations (CNVs) in humans, but few studies have been conducted to identify both of these forms coexisting in the same region.
Aims and Objectives: To map the functionally significant sites within human genes that are likely to influence human traits and diseases.
Materials and Methods: In this report, we describe an inDel map in the 1051 Tibetan CNV regions obtained through CNV genotyping using Affymetrix Genome-wide single nucleotide polymorphism 6.0 chip. InDel polymorphisms in these copy number polymorphism regions were identified with a computational approach using the 2500 deoxyribonucleic acid sequences obtained from the 1000 Genome Project.
Results: The study identified a total of 95935 inDels that range from 1 bp to several bps in length which were found scattered across regulatory regions, exons and in introns of genes underlying the CNVs. A study on the distribution of inDels revealed that the majority of inDels were found in coding regions of the genome than the noncoding, while within the genes, inDels in intron regions were more followed by exonic regions and finally the regulatory regions.
Conclusion: Study of inDels in CNV regions contribute to the enhanced understanding of the role played by the two variations and their collective influence on the genome. Further, a collection of these inDel genetic markers will aid in genetic mapping, further understanding of the phenotypic variability, identification of disease genes and in detecting novel CNVs.
Keywords: Copy number variations, insertions-deletions, insertions-deletions burden, Tibet
How to cite this article:
Veerappa AM, Vishweswaraiah S, Lingaiah K, Murthy N M, Suresh RV, Belur K, Ramachandra NB, Tejaswini, Patel NB, Supriya Gowda P K. Insertion-deletions burden in copy number polymorphisms of the Tibetan population. Indian J Hum Genet 2014;20:166-74 |
How to cite this URL:
Veerappa AM, Vishweswaraiah S, Lingaiah K, Murthy N M, Suresh RV, Belur K, Ramachandra NB, Tejaswini, Patel NB, Supriya Gowda P K. Insertion-deletions burden in copy number polymorphisms of the Tibetan population. Indian J Hum Genet [serial online] 2014 [cited 2016 Aug 23];20:166-74. Available from: http://www.ijhg.com/text.asp?2014/20/2/166/142888 |
| Introduction | |  |
Human genome consists of a diverse array of variations, which are present at various levels and at different frequencies. Some of these variations include single nucleotide polymorphisms (SNPs), insertions-deletions (inDels), segmental duplications, and copy number variations (CNVs). Though the size of the variation matters, however the location of occurrence determines the impact on the phenotype. [1],[2] SNPs were thought to be the predominant form of genomic variation and account for much of the normal phenotypic variation. [3],[4] However, widespread presence of inDels and CNVs in normal individuals seems to be a significant contributor to the phenotypic variation. [5] InDels are defined as the difference in the genome due to deletion or insertion of the nucleotides <1 kb and are distributed throughout the human genome with an average density of one inDel/7.2 kb of deoxyribonucleic acid (DNA). [6] Despite the fact that inDels are highly abundant in humans and cause a vast amount of variation in human genes, they have received less attention than SNPs and CNVs. Thus, inDels are of great interest since they can alter human traits and can cause human diseases. [7] InDels occur almost exclusively in repeat regions composed of homopolymers and multimeric simple sequence repeats, demonstrating the importance of sequence context for inDel mutations. [8] Several lines of evidence indicate that inDels in the coding region are likely to affect gene function in humans. [9] Further, a limited number of studies have looked into the effect of CNVs along with the burden load of inDel polymorphisms in the population. It will be necessary to look into inDels under CNVs, since they contribute significantly toward the genome structure and gene expression. Genome-wide CNV analyses followed by next-generation sequencing can clarify the context and burden of inDels, thereby integrating a more detailed consideration of inDels with our knowledge of nucleotide substitutions. In view of this, 31 Tibetan individuals were screened for the presence of inDels in large copy number polymorphisms (CNPs) which map to functionally significant sites within human genes, and thus, are likely to influence human traits and diseases.
| Materials and Methods | | |
For this study, 31 randomly selected normal members residing in Tibet with different age groups were selected for CNP analysis. The raw, unprocessed data from Affymetrix Genome Wide SNP 6.0 (Affymetrix Inc., Santa Clara, CA, USA) array for all the 31 individuals of Tibet population was obtained from the ArrayExpress Archive at the European Bioinformatics Institute (EBI) that was submitted by Simonson et al. [10]
Sampling process and data analysis
Generally genome data are submitted to EBI databases. In a similar way the Tibetan genome data has been obtained from EBI submitted by Simonson et al., 2010. [10] Simonson et al., genotyped Forty-nine individual DNA samples Affymetrix 6.0 SNP Array technology (Affymetrix Inc., Santa Clara, CA, USA) (>900,000 SNPs). Further, they subjected this data for default parameters for the Birdseed algorithm (version 2), the Affymetrix Genotyping Console (GTC) 3.1, (Affymetrix Inc., Santa Clara, CA, USA) principal components analysis, pair-wise genetic distances and the proportion of shared genomic segments to determine relatedness was performed. Their analysis revealed that when pairs of individuals exhibited genetic distances <4.95 × 10⁻² or had genome-wide identity-by-descent of >400 cM (minimum segment size 2.5 cM). Based on these criteria, a total of 31 unrelated individuals were included in the analyses. [10]
Copy number variation discovery
Genotyping
Genome-wide genotyping was performed using an Affymetrix Genome-wide Human SNP Array 6.0 chip having 1.8 million combined SNP and CNV markers with the median inter-marker distance of 500-600 bases. These chips provide maximum panel power and the highest physical coverage of the genome. [11] Genotyping quality was assessed using Affymetrix GTC Software. Copy number (CN) analysis method offers two types of segmenting methods, univariate and multivariate. These methods are based on the same algorithm, but use different criteria for determining cut-points denoting CNV boundaries.
Birdsuite (v2)
Birdsuite [12] is a suite originally developed to detect known common CNPs based on prior knowledge, as well as to discover rare CNVs, from Affymetrix SNP 6.0 array data (Affymetrix Inc., Santa Clara, CA, USA). To do this, it incorporates two main methods; the "Birdsuite" algorithms and the "Canary." [13] The Birdsuite algorithm uses a Hidden Markov model (HMM) approach to find regions of variable CN in a sample. For the HMM, the hidden state is the true CN of the individual's genome and the observed states are the normalized intensity measurements of each array probe. CNV calls from the Canary and Birdsuite algorithms were collated for each sample, and kept as long as they met the following criteria: (i) Birdsuite calls with a log10 of odds (LOD) score (odds ratio) ≥10 (corresponding to an approximate false discovery rate of ~ 5%), (ii) Birdsuite calls with CN states other than 2 were retained; (iii) Canary CNP calls with CN states different from the population mode were retained.
Canary
Copy number polymorphism analysis was performed using the Canary algorithm. Canary [3] was developed by the Broad Institute for making CN state calls in genomic regions with CNPs. Canary algorithm computes a single intensity summary statistic using a subset of manually selected probes within the CNP region. The intensity summaries are compared in aggregate across all samples to intensity summaries previously observed in training data to assign a CN state call.
Copy number variation finder
Copy number variation finder developed at the Welcome Trust Sanger Institute uses a dynamic, multiple-threshold based approach to allow robust classification of CN changes in data of varying qualities. This algorithm makes two main assumptions (i) That the majority of data points are normally distributed around a log2 ratio of zero, and (ii) that data points falling outside of the centralized log2 ratio distribution are representative of a difference in CN between test and reference genome.
Genotyping console
After processing CEL files and the Birdseed to call genotypes, we used the GTC (GTC version 3.0.2) (Affymetrix Inc., Santa Clara, CA, USA) to detect CNVs from the Affymetrix 6.0 array for samples that passed initial quality controls (QCs). The default parameters of >100 Kb size and >15 probes in this algorithm were used.
Data analysis
Genome-wide CNV study was carried out using SVS Golden Helix version 7.2 (SVS Golden Helix, 2010, Bozeman, Montana, USA) [14] and Affymetrix GTC software as prescribed in their manuals (Affymetrix technical notes, 2005; 2007; 2008). [3],[15],[16] EIGENSTRAT method was used to avoid possibility of spurious associations resulting from population stratification. Bonferroni correction was employed for multiple testing and the corrected data were then used for CNV testing. Bonferroni methods for population data genotyped on the Affymetrix 6.0 platform was α = 0.05 thresholds between 1 × 10⁻⁷ and 7 × 10⁻⁸ .
Analyzing the collated data from both BirdSuite and Canary algorithms increased the stringency on those meeting the CNP calls with a LOD score ≥10 corresponding to a false discovery rate of ~ 5%. All SNPs that were called using Birdseed version 2 algorithm had a QC call rate of >97% across individuals. All the subjects and members with SNPs that passed SNP QC procedures were entered into the CNV analysis. Filters were set for ID call rates for the overall SNPs to identify IDs with poor quality DNA, if any. The CNV calls were generated using the Canary algorithm. In AGCS, contrast QC has to be >0.4 to be included in the CNV analyses. In this study, contrast QC observed was >2.5 across all samples showing a robust strength. To control for the possibility of spurious or artifact CNVs, we used the EIGENSTRAT approach of Price et al. [17] This method derives the principal components of the correlations among gene variants and corrects for those correlations in the testing. CNVs were considered validated when there was a reciprocal overlap of 50% or greater with the reference set. Though, the Jaccard statistic is sensitive to the number of CNVs called by each algorithm (ideally each two algorithms would detect similar number of CNV calls), the relative values between the different comparisons of algorithms/platform/site are very informative. All the overlap analyses performed have handled losses and gains separately except when otherwise stated, and were conducted hierarchically. The calls from the algorithms that were called in both were not considered; instead, they were collated, so that the relative values between the different comparisons of algorithms/platform/site are still very informative.
Insertions-deletions discovery
2500 whole genome sequences from populations across the globe were obtained from the 1000 Human Genome project to identify the inDels in the identified CNV regions. Golden Helix GenomeBrowse™ 1.0.6 software (Bozeman, Montana, USA) was used to identify the inDels in the CNV regions found in the Tibetan genomes. The following datasets were used to determine the inDels in the genome.
- Reference Sequence, UCSC (Homo sapiens, GRCh_37)
- Reference Sequence Genes, UCSC (Homo sapiens, GRCh_37)
- 1 kG Phase 1 - Variant Frequencies 2012_04_26 v3, GHI (Homo sapiens, GRCh_37)
- NHLBI ESP5400 Exomes European American - 2011_12, GHI (Homo sapiens, GRCh_37),
- GWAS Catalog
- UCSC (Homo sapiens, GRCh_37)
- 1 kG Phase 1 EUR-Sites 2011_05, GHI (Homo sapiens, GRCh_37)
- SNPs 135, UCSC (Homo sapiens, GRCh_37),
- 1 kG Phase 1 ASN-Sites 2011_05, GHI (Homo sapiens, GRCh_37)
- 1 kG Phase 1 AFR-Sites 2011_05, GHI (Homo sapiens, GRCh_37)
- 1 kG Phase 1 All-Sites 2011_05 and GHI (Homo sapiens, GRCh_37).
| Results | | |
Whole genome CN analysis in 31 individuals from the Tibet population and their subsequent CN breakpoint analysis in 2500 sequenced genomes from the 1000 genomes project revealed the presence of inDel polymorphisms at various frequencies. Analyzing the data from the array and from those meeting the CNP calls with a LOD score ≥10 (corresponding to a false discovery rate of ~5%) criteria were selected for the study. We observed a total of 1051 CN events containing 80% duplications and 20% deletions [Figure 1]. These CNVs were seen scattered across chromosomes and were found impacting genes both entirely and partially. These polymorphisms were found enriched in genes when compared to pseudogenes. These CNVs encompassed a total of 2586 genes, which is ~10.5% of the total genes present in humans [Figure 1], which were identified frequently in multigene families compared to others. There are >10 such multigene families in the human genome where such variations were observed. The genes for alpha and beta chains of the mammalian hemoglobin molecule, actins, immunoglobulins, interferons, tubulins, hemoglobins, histones, ribosomal ribonucleic acid genes, alpha-amylase multigene family (AMY1 and AMY2), glucuronosyltransferase (UGT) gene family divided into two subfamilies, UGT1 and UGT2 are some of the multigene families where CNVs were seen. Of the CNVs identified, 85% of them contained entire coding structure of the genes while ~15% was found to be partially disrupted [Figure 1]a.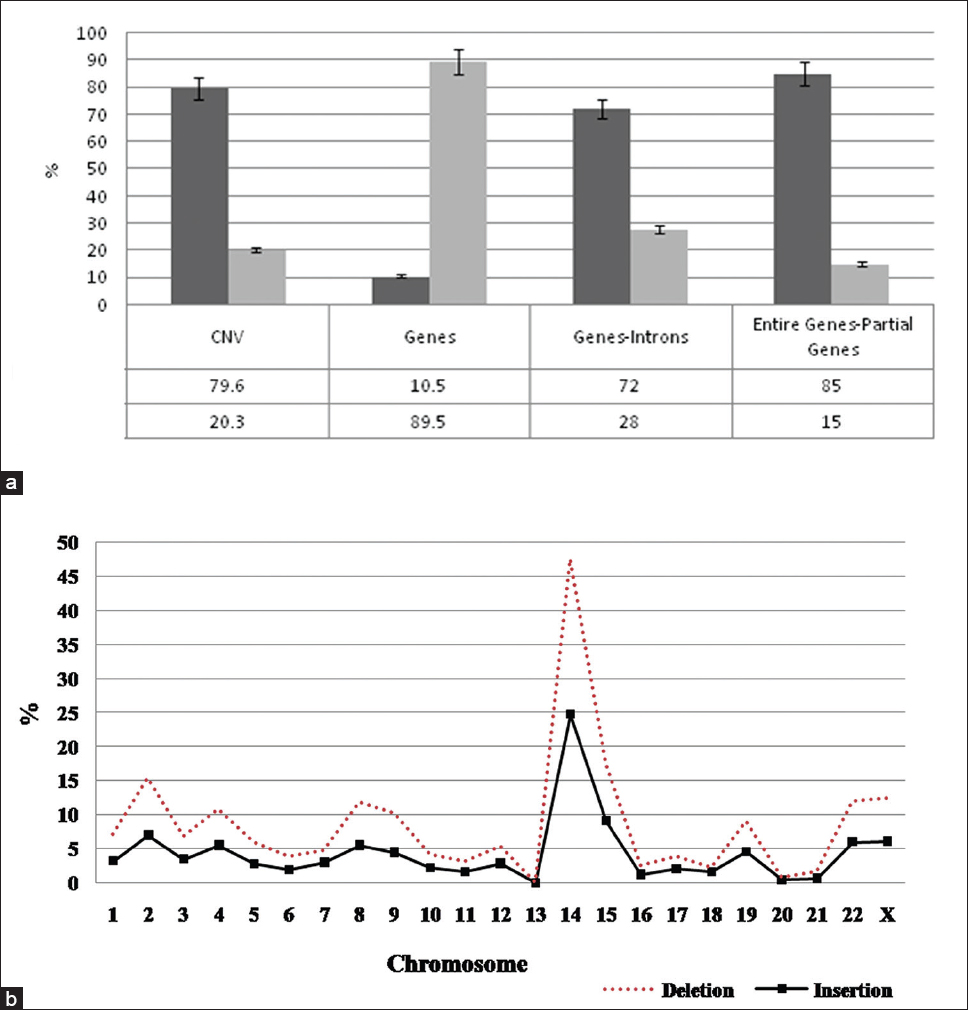 | Figure 1: (a) Distribution of copy number variations, genes identified, gene-introns ratio, and entire genes-partial genes; (b) chromosome-wise distribution of insertions and deletions in 31 subjects of Tibetan genome derived from 2500 genomes of the 1000 genome project
Click here to view |
We identified a total of 95935 inDels polymorphisms in the regulatory, exon and intron regions of the genes identified under CNVs with 37634 (39.2%) insertions and 58301 (60.7%) deletions [Table 1]. InDels were seen concentrated more in coding regions of the genes (72%) than in the intron regions (28%) [Figure 1]a. Three major classes of inDels: (i) InDels of single-base pairs (ii) monomeric base pair expansions (iii) multi-base pair expansions of 2-50 bp were observed.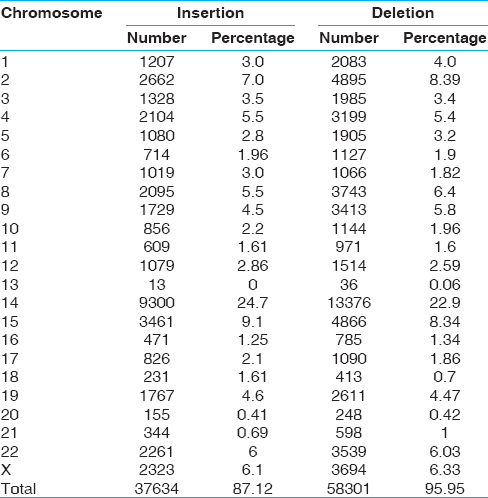 | Table 1: Chromosome wise distribution of insertion and deletions in 31 Tibetan genomes
Click here to view |
[Figure 1]b represents the distribution of inDels observed across all chromosomes except in 13 th , 20 th and 21 st . Deletions were observed to be more than insertions in almost all the chromosomes. Maximum number of inDels were observed in 14 th chromosome (47% deletions and 25% insertions) followed by chromosomes 2 (15% deletion and 7% insertions) and 15 (15% deletion and (9% insertions). Insertions were found to be equal in 11 th and 18 th chromosomes [Figure 1]b.
Insertions and deletions were observed distinctively in the regulatory, exon and intron regions of the genome [Figure 2]a-c. Intron regions showed higher number of inDel concentration followed by the exon and regulatory regions. Intron regions in seven subjects showed high concentration of inDels ranging from 10% to 18%, however, four subjects were found with 5-10% inDels and the remaining subjects were found to be with <5% variations [Figure 2]a. Around 45% of the subjects studied showed almost equal ratio of inDels in the intron regions and the remaining subjects showed increased number of deletions compared to insertions. InDels in exon regions of five subjects were between 10% and 13% and nine subjects were between 6% and 9% followed by <5% in the remaining subjects [Figure 2]b. Comparing inDel ratios of exon regions, only 16% of the subjects showed equal ratio of inDels and on the contrary, most of the remaining subjects showed increased number of insertions compared to deletions [Figure 2]b. The regulatory region showed the lowest concentration of inDels with six subjects showing inDels from 14% to 24% followed by nine subjects showing 5-9% and the remaining subjects showed variations <4% [Figure 2]c. There was almost equal number of individuals with either a higher concentration of deletions or a higher concentration of insertions. Subjects 1-7 showed concentration of inDels ranging moderate to higher in intronic and exonic regions, but showed very less inDel presence in the regulatory region. InDels were found to be less in regulatory region when compared against the concentration of inDels in intronic and exonic regions.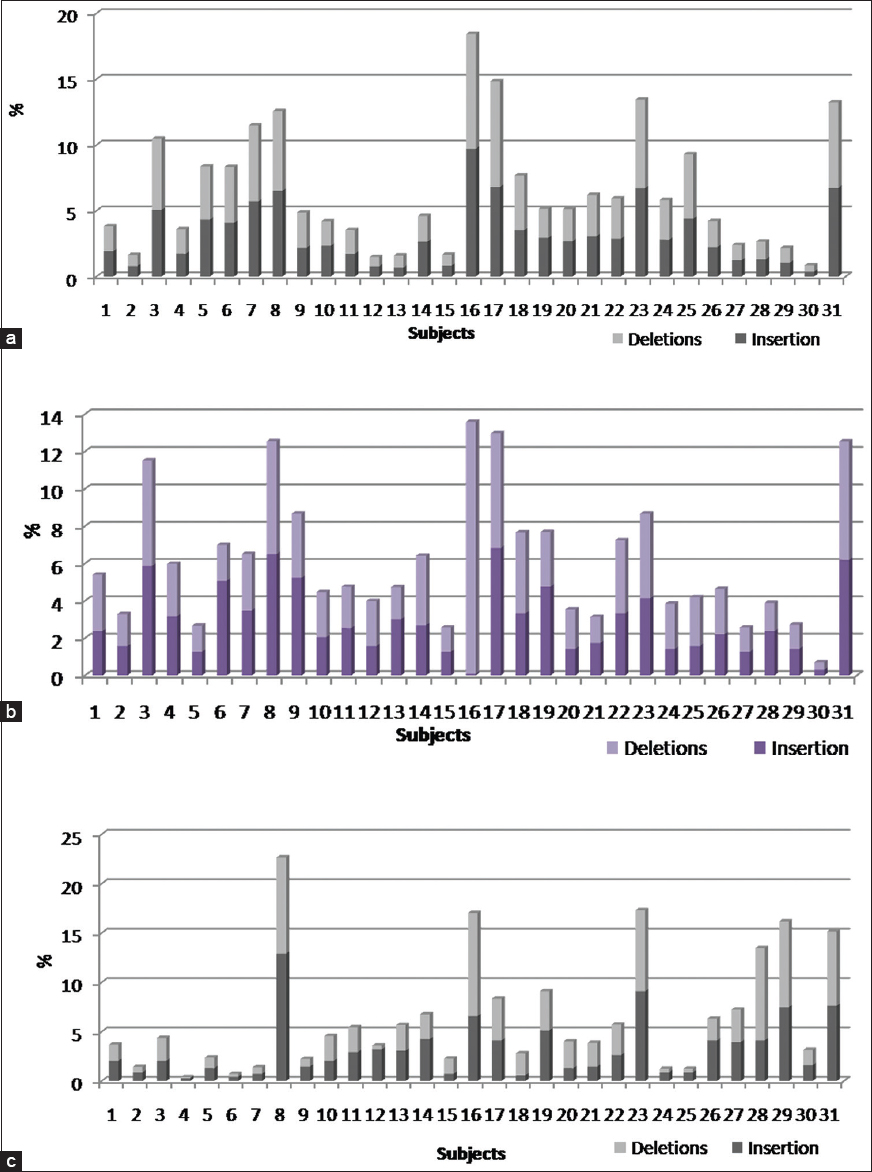 | Figure 2: Insertions and deletions in Tibetan individuals. (a) Intronic regions (b) Exonic regions and (c) Regulatory regions of genes under the copy number polymorphisms of the Tibetan genome
Click here to view |
The genomes of male and females were examined for the presence of inDel bias, if any. Females and males showed almost equal number of insertions 38.7% and 38.8% and deletions being 61.2% and 61.1%. Distribution of inDels was observed across chromosomes in the regions of CNVs. In the regulatory region, the number of deletions was found more in 8 th chromosome. The ratio of inDel was observed to be almost equal in chromosomes 1, 9, 15 and 19, however, in chromosomes 3-6, 10, 11, 12 and 22, insertions were more than the deletions, but in chromosomes 7, 8, 14, 16, 17, 21 and X, deletions were more than insertions [Figure 3]a. In the exonic region of CNVs, the number of deletions is highest in the fifteenth chromosome and the ratio of inDel is almost equal in chromosomes 16, 19 and 3. In chromosomes 1, 2, 4, 6, 14, 17, 18 and X, insertions were more than deletions, whereas in chromosomes 5, 7-11, 15, 20-22 deletions were found to be more than insertions [Figure 3]b. In the intronic region of CNVs, the number of deletions is more in the X chromosome, and the ratio of inDel is almost equal in chromosomes 1, 2, 5, 6, 7, 8, 18, 20 and 21. In chromosomes 3, 4, 9, 10, 12, 16, 17 and 19 insertions are more than deletions, whereas in chromosomes 11, 14, 15, 22 and X, deletions are more than insertions [Figure 3]c.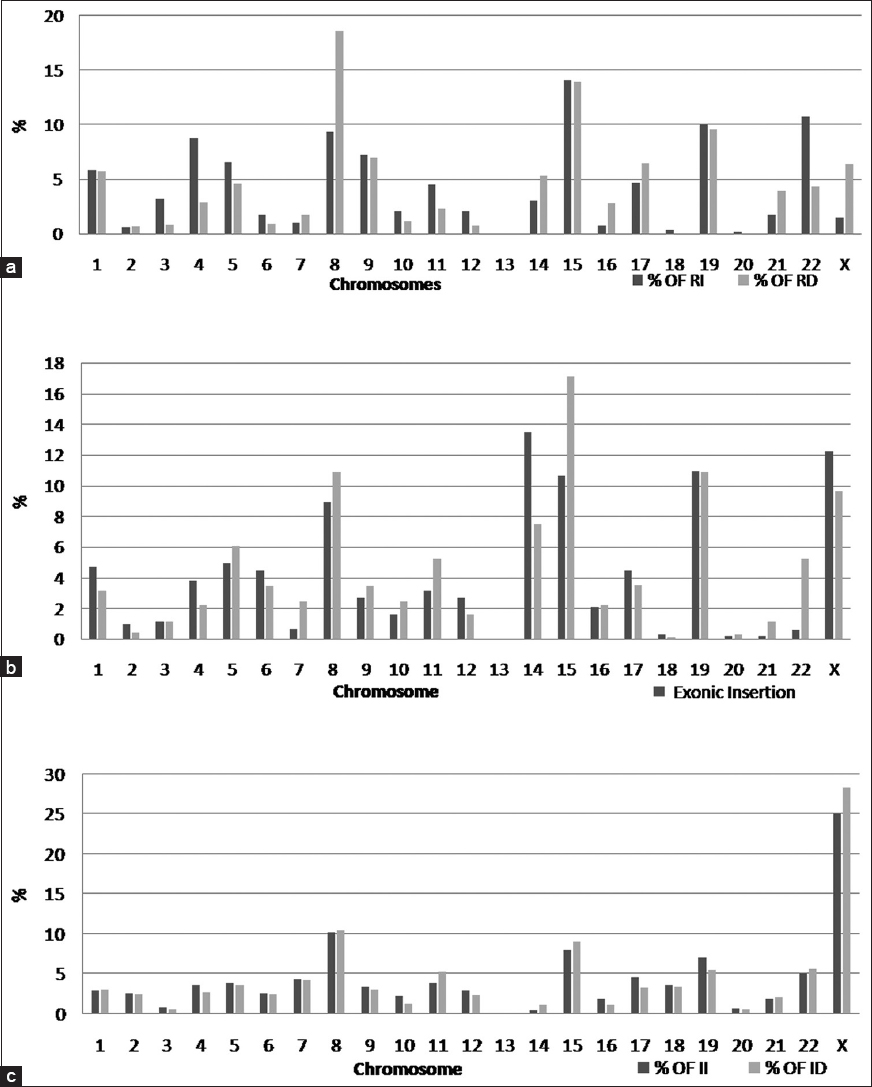 | Figure 3: Chromosome wise distribution of insertions-deletions across chromosomes in the (a) Regulatory region, (b) Exonic region and (c) Intronic region of Tibetan genome
Click here to view |
| Discussion | | |
Insertions-deletions are an abundant form of structural variations in the genome alongside SNPs and CNVs in terms of numbers and size. [18] It is important to estimate the presence of burden load of inDel polymorphism in the regions of CN to assess its contribution towards the phenotypic variability. These variations in the CN regions will also help in increasing the coverage of the markers for designing high resolution DNA chip. Our study of large CNVRs revealed a range varying from 100 kb to several Mbs scattered across all the chromosomes. Duplications CNVs observed were more frequent than deletion CNVs and were found impacting genes both entirely and partially. The identified inDels in these regions of the CNP of the Tibetan genome revealed a considerable load of single-base pair expansion, monomeric base pair expansions and multi-base pair polymorphisms.
About 10.5% of the genes were under the influence of CNP, and a significant number of genes among them were found to be containing inDel variations. Deletions of single base pair to multi base pair were more compared to insertion variations. InDels within the regulatory and exon regions of a gene are known to cause syndromes in humans. The presence of inDels in 3 bp manifold maintains the open reading frames of the proteins intact and those, which are not in the manifold of 3 bp cause frame shifts in the encoded proteins, which are expected to disrupt gene function. [19] Deletion variations were observed to be higher than insertion variations in the polymorphic regions across all the chromosomes and interestingly chromosome 14, 15, 2 and 8 were observed bearing a mass of these variations. The presence of either the copy number or the existence of the amount of genes in these chromosomes would hardly be the reason, since the presence of copy number or genes in other chromosomes is almost similar. Hence, this poses a great challenge to identify the reason behind such a complexity, and the genomic architecture in these regions should be further looked into, to reason out for these higher numbers of inDels.
The presence of inDels in the copy number regions of the subjects was observed to be in diverse forms and frequency. The array of subjects can be divided into quartiles for better understanding of their inDel structure. The first quartile contains subjects 1-8, the second quartile contains subjects from 9 to 15 and the third and fourth quartile contains 16-23 and 24-31 respectively. The subjects from first quartile show balanced frequency of inDels in intronic and exonic regions, but show very less concentration of inDels in regulatory regions. The subjects in second quartile show balanced frequency of inDels in intronic and regulatory regions, but show a higher frequency in exonic regions. The subjects in third quartile resemble the subjects from first quartile with a slightly higher concentration of inDels and the subjects in the fourth quartile show complex frequency and inconsistent pattern of inDel presence in all the three genomic regions. It is probably this diverse and inconsistent presence of inDels, which enables human to be phenotypically different and unique. This load of inDel polymorphism in the genome, presence of copy number regions, and the load of inDels in the copy number regions of the genome will be complex and intricate in understanding the contribution of these towards the phenotype since each of these polymorphism has to be analyzed individually and in tandem since it occurs on functionally important coding regions of the genome. InDels in the regulatory region alter the methylation patterns of the promoter leading to changes in gene expression. [20] However, inDels that occur within the transcription factor binding sites or enhancers are found to diminish or abolish gene expression. [7] This alteration is thought to be due to the phasing and spacing of DNA sequences within promoters caused by the inDels, which explains the differences in gene expression that has been observed in diverse humans. [5] InDels in the coding region are likely to have a major impact on human biology and diseases due to the insertion or deletions of the amino acid(s), though, in other cases, inDels in the in-frame may not coincide perfectly with codon boundaries enabling additional amino acid changes that may also occur in the region that is altered. [5] The coding regions that were under the burden load of inDels were found to be involved in several medically relevant biological pathways, including drug and lipid metabolism. A study by Zhang et al., [21] showed genetic features contributed by CNVs in Tibetan population revealed distinct CNV allele frequencies and were enriched for genes in the disease classes of human reproduction and biological process categories of "response to DNA damage stimulus" and "DNA repair."
Chromosomes showed various concentrations of inDels with very few in 13 th , 20 th and 21 st . Chromosomes 14, 2 and 15 show almost equal number of CNVs compared to other chromosomes, but show higher concentration of inDels compared to any other chromosomes, which we believe is due to the presence of some repetitive elements in the CNV regions. Intron region contained the highest number of inDels compared with exon and regulatory region. High prevalence of inDels in the intron region can be owed to the ineffectuality of those variations in the genome. Exon region showed more inDels compared with regulatory region and it is these regions which contribute significantly toward the expression of the phenotype. In general, inDels in the regulatory region reduce the expression of the downstream genes, and similarly, inDels in the exon region truncate the coding structure of the gene depending on the location of the variation. [22] Both male and female genomes were checked for the bias of inDel, but the frequency of inDel was similar in both females and males. Chromosomes 1, 9, 15 and 19 show almost equal number of CNVs and also the ratio of inDel in these chromosomes are almost equal.
A collection of these inDel genetic markers thus helps in, genetic mapping, identification of disease genes and in human identity testing. The identification of these variations adds up to the existing catalogue of variations and this is the first study which looks into the effect of inDels in CNVs on the genome. The identification of the inDel variations in the regions of CNV will further help in increasing the coverage of the genome and in detecting novel CNVs. Further studies are required to understand the genome topology and to analyze the combined effect of inDels and CNVs on the genome structure, gene expression and phenotype.
| Acknowledgment | | |
We thank the University of Mysore for providing facility to conduct this work; CSIR, New Delhi for awarding Fellowship to KL (CSIR Order No. 9/119 (0196) 2K13-EMR-I Dated: 19.03.2013); Prof. H. A. Ranganath, Mr. Somanna A. N., University of Mysore for their encouragement and support.
| References | | |
| 1. | Walsh T, McClellan JM, McCarthy SE, Addington AM, Pierce SB, Cooper GM, et al. Rare structural variants disrupt multiple genes in neurodevelopmental pathways in schizophrenia. Science 2008;320:539-43.  |
| 2. | Need AC, Ge D, Weale ME, Maia J, Feng S, Heinzen EL, et al. A genome-wide investigation of SNPs and CNVs in schizophrenia. PLoS Genet 2009;5:e1000373. |
| 3. | Affymetrix, Inc. User Manual: Genotyping Console™ Software 2.1;2008. |
| 4. | International Hap Map Consortium. A haplotype map of the human genome. Nature 2005; 437:1299-320. |
| 5. | Frazer KA, Murray SS, Schork NJ, Topol EJ. Human genetic variation and its contribution to complex traits. Nat Rev Genet 2009;10:241-51. |
| 6. | Mills RE, Luttig CT, Larkins CE, Beauchamp A, Tsui C, Pittard WS, et al. An initial map of insertion and deletion (INDEL) variation in the human genome. Genome Res 2006;16:1182-90. |
| 7. | Mullaney JM, Mills RE, Pittard WS, Devine SE. Small insertions and deletions (INDELs) in human genomes. Hum Mol Genet 2010;19:R131-6. |
| 8. | Williams LE, Wernegreen JJ. Sequence context of indel mutations and their effect on protein evolution in a bacterial endosymbiont. Genome Biol Evol 2013;5:599-605. |
| 9. | Mills RE, Pittard WS, Mullaney JM, Farooq U, Creasy TH, Mahurkar AA, et al. Natural genetic variation caused by small insertions and deletions in the human genome. Genome Res 2011;21:830-9. |
| 10. | Simonson TS, Yang Y, Huff CD, Yun H, Qin G, Witherspoon DJ, et al. Genetic evidence for high-altitude adaptation in Tibet. Science 2010;329:72-5. |
| 11. | Affymetrix, Inc. Data Sheet: Genome Wide Human SNP Array 6.0;2009. |
| 12. | |
| 13. | White Paper: Affymetrix ® Canary Algorithm Version 1.0.; 2008. p. 1-7. [Last Accessed on 2013 May 12]. |
| 14. | |
| 15. | Affymetrix, Inc. Technical Note: Guide to Probe Logarithmic Intensity Error (PLIER) Estimation; 2005. |
| 16. | Affymetrix, Inc. White Paper: BRLMM-P: A Genotype Calling Method for the SNP Array 5.0;2007. |
| 17. | Price AL, Patterson NJ, Plenge RM, Weinblatt ME, Shadick NA, Reich D. Principal components analysis corrects for stratification in genome-wide association studies. Nat Genet 2006;38:904-9. |
| 18. | McKernan KJ1, Peckham HE, Costa GL, McLaughlin SF, Fu Y, Tsung EF, et al. Sequence and structural variation in a human genome uncovered by short-read, massively parallel ligation sequencing using two-base encoding. Genome Res 2009;19:1527-41. [ PUBMED] |
| 19. | Volfovsky N, Oleksyk TK, Cruz KC, Truelove AL, Stephens RM, Smith MW. Genome and gene alterations by insertions and deletions in the evolution of human and chimpanzee chromosome 22. BMC Genomics 2009 26;10:51. |
| 20. | Sachidanandam R, Weissman D, Schmidt SC, Kakol JM, Stein LD, Marth G, et al. A map of human genome sequence variation containing 1.42 million single nucleotide polymorphisms. Nature 2001;409:928-33. |
| 21. | Zhang YB, Li X, Zhang F, Wang DM, Yu J. A preliminary study of copy number variation in Tibetans. PLoS One 2012;7:e41768. |
| 22. | Snyder M, Du J, Gerstein M. Personal genome sequencing: Current approaches and challenges. Genes Dev 2010;24:423-31. |
[Figure 1], [Figure 2], [Figure 3]
[Table 1]
|