|
 
 |
| ORIGINAL ARTICLE |
|
| Year : 2014 | Volume
: 2
| Issue : 2 | Page : 60-67 |
|
Soft-tissue characteristics of Class-II Division-1 malocclusion in North Indian adult population: A cephalometric study
Rana Pratap Maurya1, Vijay Prakash Sharma2, Pradeep Tandon3, Amit Nagar3, Sneh Lata Verma1
1 Department of Orthodontics and Dentofacial Orthopedics, Babu Banarasi Das College of Dental Sciences, Lucknow, India
2 Department of Orthodontics and Dentofacial Orthopedics, Chandra Dental College, Barabanki, Uttar Pradesh, India
3 Department of Orthodontics and Dentofacial Orthopedics, K. G. Medical University, Lucknow, India
| Date of Web Publication | 22-Apr-2014 |
Correspondence Address:
Rana Pratap Maurya
Flat No. 204, New Teachers Residential Building, T. G. Campus, Khadra, Lucknow - 226 003, Uttar Pradesh
India
 Source of Support: None, Conflict of Interest: None  | Check |
DOI: 10.4103/2321-3825.131115

Background: Facial harmony in orthodontics is determined by the morphologic relationships and proportions of the nose, lips and chin. For the correction of all malocclusions, the facial outlines should be regarded as an important guide in developing a proper treatment plan. Aims and Objectives: (1) The primary aim is to evaluate and compare the soft tissue pattern associated with Angle's Class I normal occlusion and Angle's Class-II Division-1 malocclusion in North Indian adult population. (2) The secondary is to access sexual dimorphism for the soft-tissue characteristics. Materials and Methods: Lateral cephalograms of 80 orthodontically untreated adult subjects, 40 were having normal occlusion with good facial profile (Group-A: 20 males-mean age 22.89 years and 20 females-mean age 21.27 years) and 40 subjects with Angle's Class-II Division-1 malocclusion (Group-B: 20 males-mean age 20.25 years and 20 females-mean age 19.67 years) were analyzed. Methodology: Lateral cephalograms of the subjects were taken in natural head position and were traced manually. 16 linear and 6 angular soft-tissue parameters were measured which were derived from the Steiner, Ricketts, Burstone and Holdaway soft-tissue analyses. All the values were compared using Student's t-test with a level of significance at P < 0.05. Results: Group-B males had decreased lower lip length, lower face height, nasomental angle (P < 0.001) and lip length ratio (P < 0.01) whereas increased interlabial gap, upper lip to Sn-Pg', total facial contour angle, maxillomandibular contour angle (P < 0.001), lower lip to Sn-Pg' angle (P < 0.01) when compared to Group-A males. There was an apparent sexual dimorphism was found in soft-tissue pattern of both the groups. Conclusions: Class-II Division-1 malocclusion have more convex soft-tissue profile, reduced nose length, Shorter procumbent lips and flatter chins when compared to Angle's Class I malocclusion. Keywords: Class I normal occlusion, Class-II Division-1 malocclusion, North Indian adult population, soft tissue
How to cite this article:
Maurya RP, Sharma VP, Tandon P, Nagar A, Verma SL. Soft-tissue characteristics of Class-II Division-1 malocclusion in North Indian adult population: A cephalometric study. J Orthod Res 2014;2:60-7 |
How to cite this URL:
Maurya RP, Sharma VP, Tandon P, Nagar A, Verma SL. Soft-tissue characteristics of Class-II Division-1 malocclusion in North Indian adult population: A cephalometric study. J Orthod Res [serial online] 2014 [cited 2018 Feb 27];2:60-7. Available from: http://www.jorthodr.org/text.asp?2014/2/2/60/131115 |
| Introduction | |  |
Harmonious facial esthetics and functional occlusion have long been recognized as the main goals in orthodontic treatment. Facial harmony in orthodontics is determined by the morphologic relationships and proportions of the nose, lips and chin. Orthodontic treatment by altering the dentoskeletal framework may produce desirable or undesirable alterations on the face. Analysis of dentoskeletal patterns only may prove inadequate or misleading, as marked variations do exist in the soft-tissue covering the dentoskeletal framework. To interpret the diagnostic information relating to the soft tissue profile various analyses has been developed by various authors. [1],[2],[3],[4],[5] Chaconas, [6] Bishara and Jakobsen [7] Nanda [8] have studied the growth changes in the soft tissue facial profile and its importance in predicting post orthodontic facial changes.
As there is variability in the craniofacial morphology and nature of soft tissue profile among different populations and ethnic groups, most of the norms which are based on the Caucasian population cannot always be applied to the other racial groups. Keeping in mind the present study has been conducted with the purpose of evaluating the soft-tissue pattern of North Indian population in normal occlusion, Angle's Class-II Division-1 malocclusions and comparing them with each other.
| Materials and Methods | | |
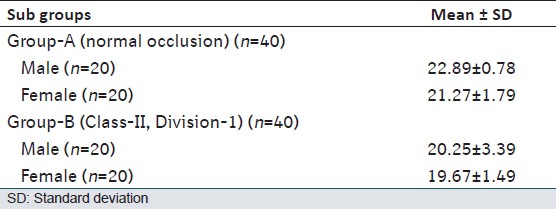
Lateral cephalograms of 80 orthodontically untreated North Indian adult subjects, 40 were having normal occlusion with good facial profile (Group-A) and 40 subjects with Angle's Class-II Division-1 malocclusion (Group-B) were analyzed. Each group was further divided into male and female subgroups [Table 1].
Selection Criteria for the Class I Normal Occlusion Sample
- Pleasing soft-tissue profile.
- Bilateral Angle's Class I molar relationship in centric occlusion with normal overjet and overbite.
- Well-aligned maxillary and mandibular arches with <2 mm crowding or spacing.
- No congenitally missing teeth, congenital anomalies or facial asymmetry present.
- No missing teeth (except 3 rd molar).
Selection Criteria for the Class-II Division-1 Sample
- Bilateral Angle's Class-II molar relationship with convex facial profile.
- Proclination of maxillary front teeth with an overjet of >3 mm.
- No congenitally missing teeth, congenital anomalies or facial asymmetry present.
- ANB angle >4°.
- No missing teeth (except 3 rd molar).
Method
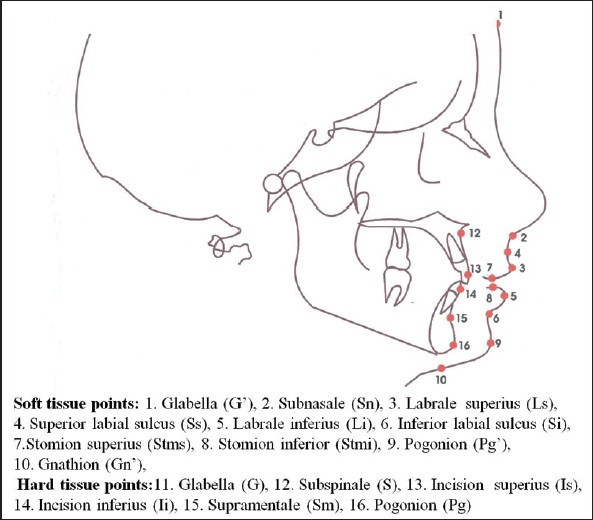
The lateral cephalograms obtained from the department were taken by properly positioning the subjects on a Universal Counterbalancing type of cephalostat with the Frankfort Horizontal plane parallel to the floor and the teeth in centric occlusion. All cephalograms had been taken with subjects in a standing position with relaxed lips because relaxed lip position has been suggested as the best posture for cephalometric soft-tissue evaluation Burstone. [3] All cephalograms should have good definition of hard and soft-tissue structures and profiles. After placing registration points on the cephalograms, all the cephalograms were traced on acetate tracing sheets manually. The linear and angular measurements were made to the nearest 0.5 mm and 0.5° respectively with the help of millimeter ruler and protractor.
Methods of Analysis
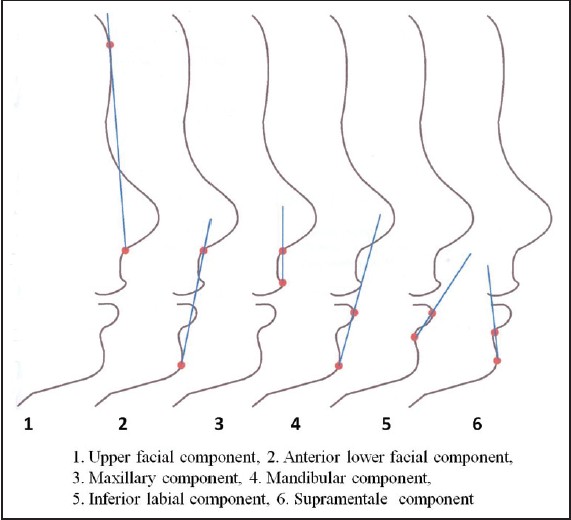
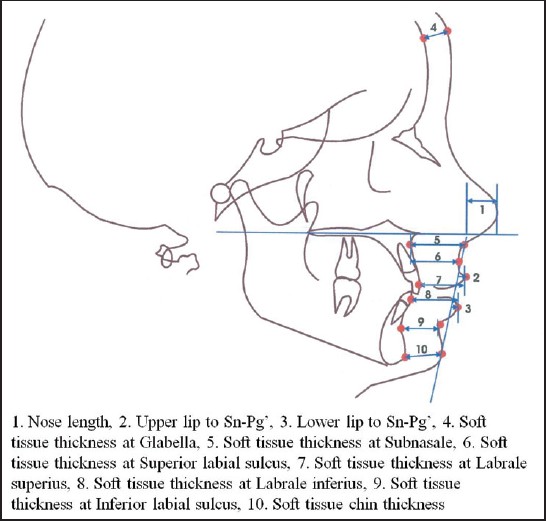
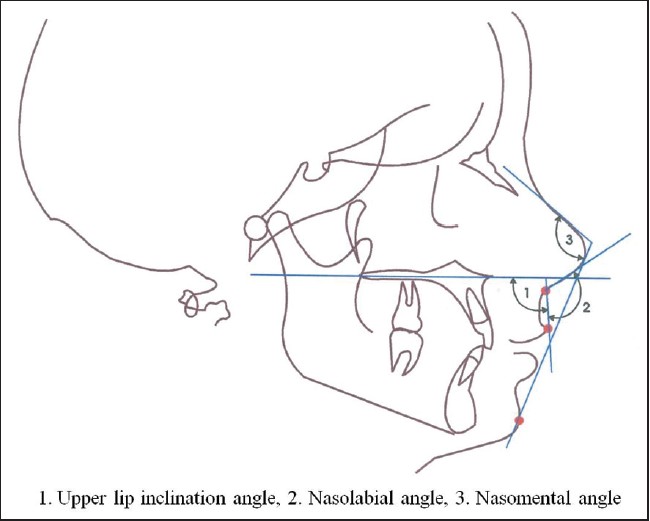
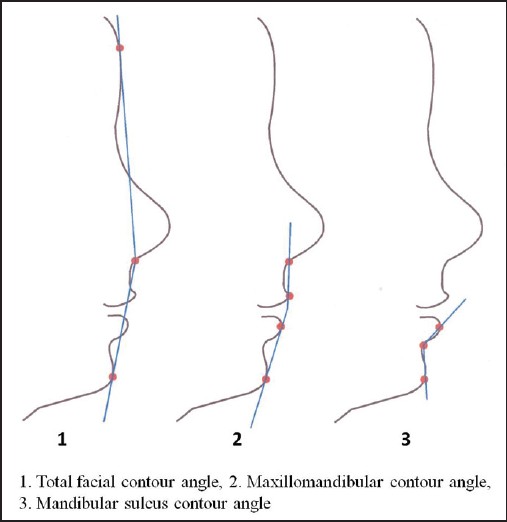
- Evaluation and comparison of soft-tissue variables in Group-A, Group-B and the subgroups in male and female are shown in [Figure 1],[Figure 2],[Figure 3],[Figure 4],[Figure 5] and [Figure 6].
Statistics
Descriptive data that include mean, standard deviation and range values were calculated for each group. The sample size of present study showed approximately 80% power (α = 0.05) to reject the null hypothesis of zero correlation. 95% confidence interval (limits) were provided for Group-A and Group-B. Between groups were compared by using Student t-test. P < 0.05 were considered as statistically significant difference.
Measurement of Reliability
Reliability of measurement was tested by doing double determinations of 10 cephalograms randomly selected at 15 days interval from the collected sample by the same operator. The comparison was drawn between 1 st and 2 nd determinations by Student's t-test. There was insignificant difference between 1 st and 2 nd measurements [Table 2].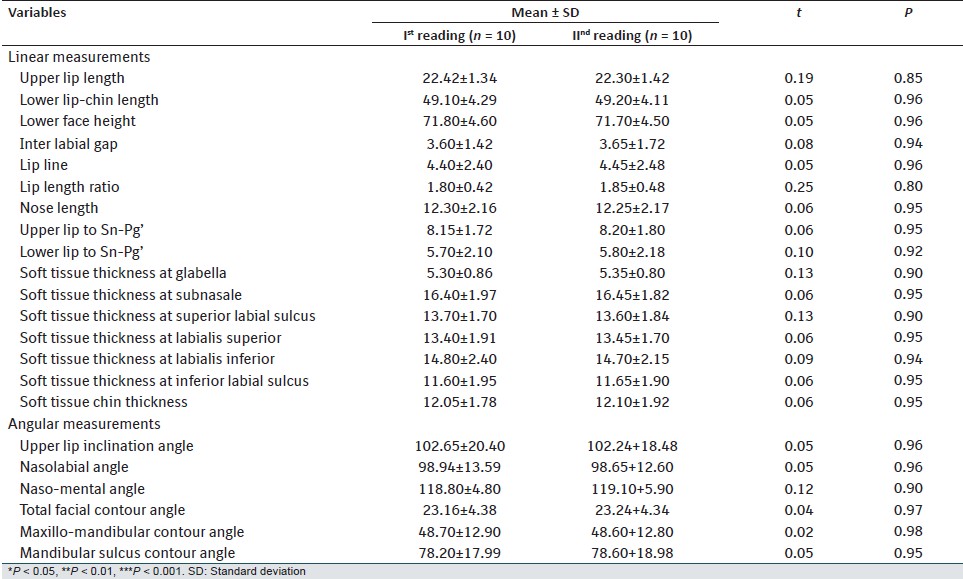 | Table 2: Reliability analysis of cephalometric variables at two different time intervals
Click here to view |
| Results | | |
When mean values of soft-tissue variables of Group-A males and females were compared [Table 3] lower lip-chin length, lower face height, lip length ratio, soft-tissue thickness at superior labial sulcus, soft-tissue thickness at labialis superior, soft-tissue chin thickness, nasomental angle and mandibular sulcus contour angle were found significantly lower whereas the lip line and total facial contour angle were found significantly higher in females. When Group-B males and females were compared [Table 4] upper lip length, upper lip to Sn-Pg', soft-tissue thickness at subnasale, at superior labial sulcus, at labialis superior, at labialis inferior, at inferior labial sulcus, total facial contour angle, maxillomandibular contour angle and mandibular sulcus contour angle were found significantly higher in male.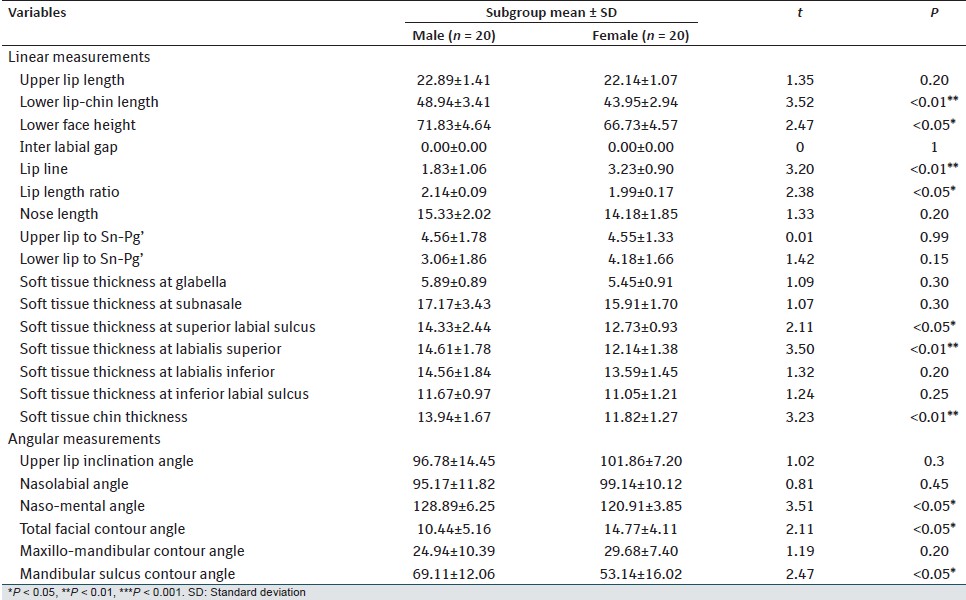 | Table 3: Mean and SD values of soft tissue variables in Group-A (normal occlusion) and its comparison in male and female
Click here to view |
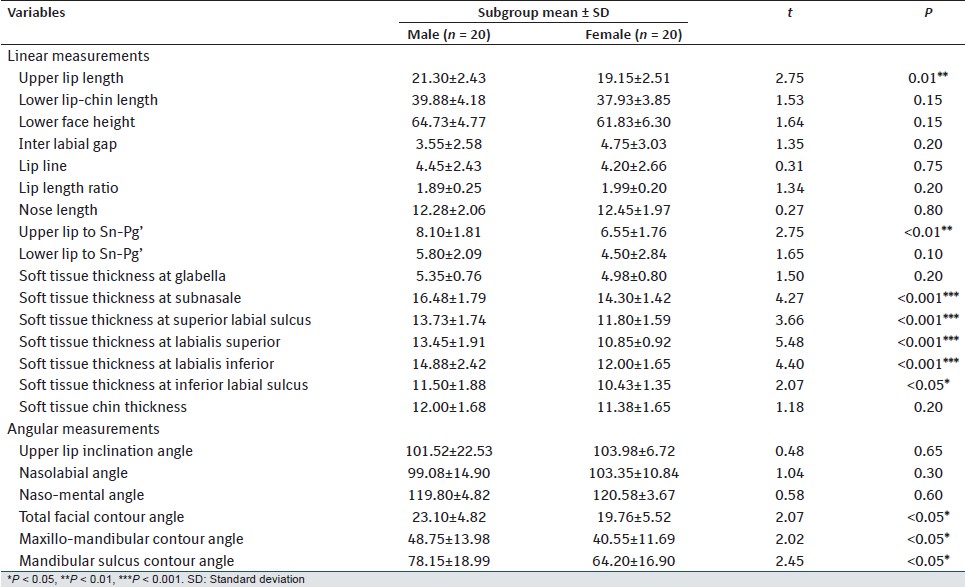 | Table 4: Mean and SD values of soft tissue variables in Group-B (Class-II, Division-1 malocclusion) and its comparison in male and female
Click here to view |
On comparison of Group-A and B males [Table 5], Group-B males had significantly higher values for interlabial gap, lip line, upper and lower lip to Sn-Pg', total facial contour angle and maxillomandibular contour angle. Whereas Group-A males had significantly higher values for Lower lip-chin length, lower face height, soft-tissue chin thickness and nasomental angle. Comparing the Group-A and B females [Table 6], females in Group-B had significantly higher values for interlabial gap, total facial contour angle and maxillomandibular contour angle. Whereas Group-A females had significantly higher values for upper lip length, Lower lip-chin length, nose length, soft-tissue thickness at subnasale, at labialis superior, and at labialis inferior.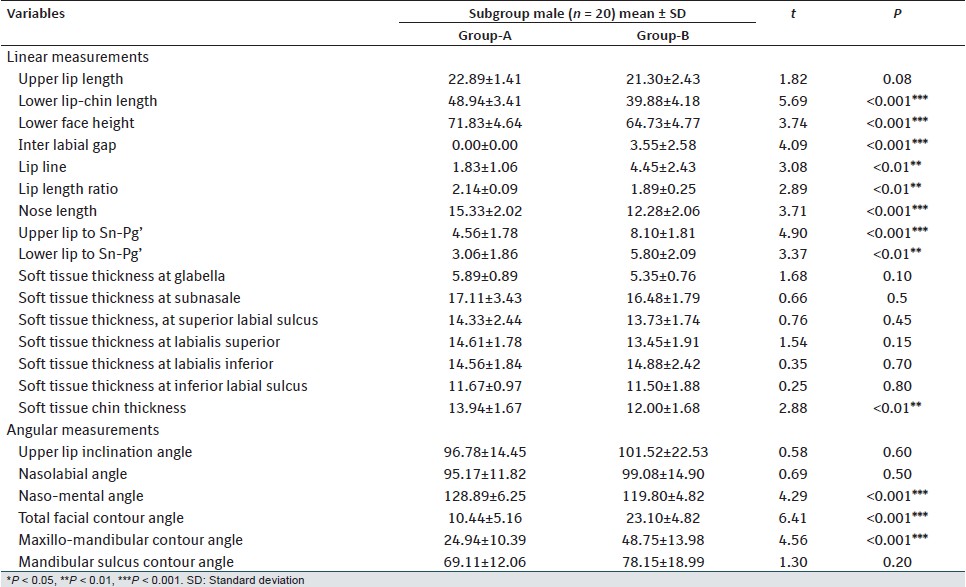 | Table 5: Comparison of soft tissue variables in Group-A (normal occlusion) versus Group-B (Class-II, Division-1 malocclusion) in male
Click here to view |
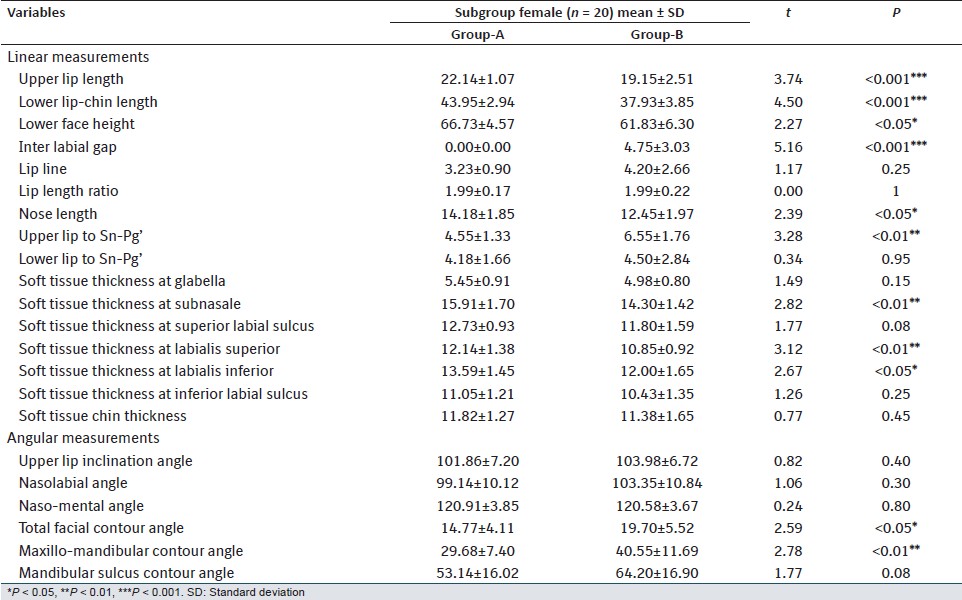 | Table 6: Comparison of soft tissue variables in Group-A (normal occlusion) versus Group-B (Class-II, Division-1 malocclusion) in female
Click here to view |
| Discussion | | |
Variation in the soft-tissue veneer over the dentoskeletal framework can be an important factor in case analysis, as it influences facial form and esthetics and muscle balance of the orbicularis oris complex and hence the stability of the anterior dental segment. [9] Tweed [10] and McNamara et al. [11] emphasized that one of the most important components of orthodontic diagnosis and treatment planning is the evaluation of the soft tissue. Further Subtelny, [1] Burstone [9] and Bowker and Meredith [12] have recommended that the analysis of the soft tissue should be taken into consideration for the proper evaluation of the underlying skeletal discrepancy because of individual differences in soft-tissue thickness, although this variability has no relationship to the configuration of the hard tissues. Numerous soft-tissue analyses had been developed to interpret the diagnostic information that the lateral cephalogram provides. [4],[5],[13],[14]
Since malocclusion, tooth stability and facial esthetics are influenced by the total mass, positions in space and general activity of soft-tissue structures and lip posture, the orthodontists are vitally concerned with soft-tissue morphology in various malocclusions. Hence this study was conducted to evaluate the soft-tissue pattern of Class-II Division-1 malocclusion and to compare it with normal occlusion sample.
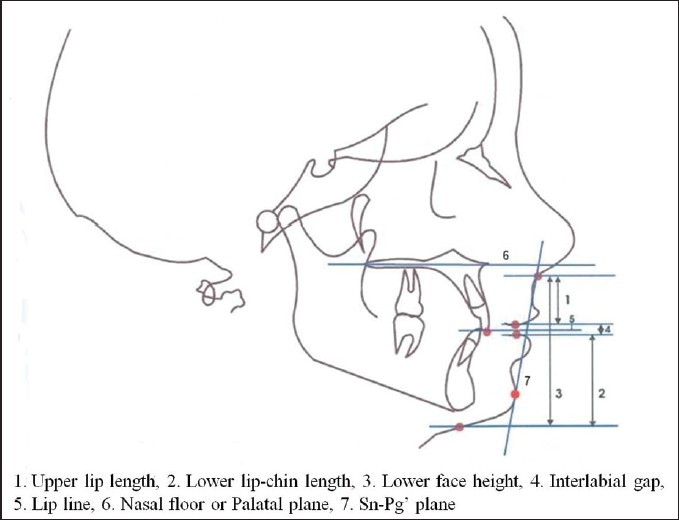
Sn-Pg' plane was used for evaluation of lip position and palatal plane to measure horizontal and vertical linear measurements, because it remains relatively stable throughout growth [15] and it approaches a horizontal position in erect posture and thereby aids the visualization of profile components in space. Profile components (line segments) were taken for forming contour angles which represent the intricate morphology of the integumental profile. [16]
In the present study, both Group-A and B males had higher values of almost all the vertical and horizontal linear measurements as compared to females, similar finding was reported by Burstone, [9] Arnett et al., [17] Alessandra and Barnett. [16] Lower lip-chin length, lower face height, lip length ratio, soft-tissue thickness at labialis superior and soft-tissue chin-thickness were significantly higher in males as suggested by Burstone, [3],[9] Merrifield, [13] Powell and Humphreys [15] and Farkas and Kolar. [18] The lip line was found significantly lower in males this may be due to variation in upper lip length which was shorter in female. Nasomental angle and mandibular sulcus contour angle was higher in males whereas total facial contour angle was higher in females. This may be due to greater soft-tissue chin thickness in male.
When Group-B male and female were compared [Table 4] the soft-tissue pattern was found similar to Group-A and it was supported by studies of Burstone [9],[16] and Arnett et al. [17] Upper lip length, upper lip to Sn-Pg', soft-tissue thickness at superior labial sulcus, at labialis superior, at labialis inferior and at inferior labial sulcus along with total facial contour angle, maxillo-mandibular contour angle and mandibular sulcus contour angle were significantly higher in male. Very few research works has been done in this direction and hence literature is scant to support these findings.
When Group-B (male and female) was compared to Group-A [Table 5] and [Table 6], difference in the soft-tissue pattern was observed. Upper lip length was shorter in Group-B, this was supported by Burstone [3] who also found short upper lip in Class-II Division-1 malocclusion. Whereas lower lip-chin length and lower face height was significantly lower in Group-B for both males and females, which may be due to low anterior facial height and more horizontal growth pattern. Inter labial gap was found significantly more in Group-B, this variation may be due to differences in length of either or both lips and protrusion of the maxillary incisor teeth. [3]
Short nose length and protruded lips were found in Group-B, may be due to the hypoactive perioral muscles around the upper lip and proclined maxillary incisors which reduce the effective length of nose. These findings were in agreement with Subtelny [1] and Burstone [3] who reported that lips are closely related to the teeth and alveolar process and lip posture is closely related to underlying structures.
Total facial contour angle, maxillo-mandibular contour angle and lip line were significantly higher in Group-B for both males and females while nasomental angle was significantly lower in only Group-B males. These variations might have resulted from a retruded mandible or proclined maxillary incisors and short upper lip is in Class-II Division-1 malocclusion, as stated by Burstone. [3] Lip length ratio was found to be significantly lower in Group-B males, whereas for females difference was insignificant. This may be due to decreased lower lip-chin length in Group-B males. Soft-tissue chin thickness was found significantly lesser in Group-B males, whereas for females difference was insignificant. Burstone [9] suggested that soft-tissue chin thickness varies; it may be less as found in our study or may be greater in order to compensate underlying skeletal discrepancy. Soft-tissue thickness at labialis superior, labialis inferior and at inferior labial sulcus was found to be significantly lower in Group-B females.
| Conclusion | | |
Following conclusions were drawn from this study:
- Angle's Class-II Division-1 malocclusion subjects have a decreased lip length, lower face height, lip length ratio and nasomental angle; and increased interlabial gap, upper lip to Sn-Pg', lower lip to Sn-Pg', total facial contour angle and maxillomandibular contour angle as compared to Class-I malocclusion.
- There was an apparent sexual dimorphism in soft-tissue pattern in Angle's Class-II Division-1 malocclusion.
| References | | |
| 1. | Subtelny JD. A longitudinal study of soft-tissue facial structures and their profile characteristics defined in relation to underlying skeletal structure. Am J Orthod 1959;45:481-507. 
|
| 2. | Steiner CC. The use of cephalometris as an aid to planning and assessing orthodontic treatment. Am J Orthod 1960;46:721-35.
|
| 3. | Burstone CJ. Lip posture and its significance in treatment planning. Am J Orthod 1967;53:262-84.
[PUBMED] |
| 4. | Ricketts RM. Esthetics, environment, and the law of lip relation. Am J Orthod 1968;54:272-89.
[PUBMED] |
| 5. | Holdaway RA. A soft-tissue cephalometric analysis and its use in orthodontic treatment planning. Part I. Am J Orthod 1983;84:1-28.
[PUBMED] |
| 6. | Chaconas SJ. A statistical evaluation of nasal growth. Am J Orthod 1969;56:403-14.
[PUBMED] |
| 7. | Bishara SE, Jakobsen JR. Longitudinal changes in three normal facial types. Am J Orthod 1985;88:466-502.
[PUBMED] |
| 8. | Nanda RS, Meng H, Kapila S, Goorhuis J. Growth changes in the soft tissue facial profile. Angle Orthod 1990;60:177-90.
|
| 9. | Burstone CJ. Integumental contour and extension patterns. Angle Orthod 1959;29:93-104.
|
| 10. | Tweed CH. Indications for the extraction of teeth in orthodontic procedure. Am J Orthod Oral Surg 1944;42:22-45.
[PUBMED] |
| 11. | McNamara JA Jr, Brust EW, Riolo ML. Soft tissue evaluation of individuals with an ideal occlusion and a well-balanced face. In: McNamara JA Jr, editor. Esthetics and the Treatment of Facial Form. Craniofacial Growth Series. Ann Arbor, Mich: Center for Human Growth and Development, The University of Michigan; 1992. p. 115-46.
|
| 12. | Bowker WD, Meredith HV. A metric analysis of the facial profile. Angle Orthod 1959;29:149-60.
|
| 13. | Merrifield LL. The profile line as an aid in critically evaluating facial esthetics. Am J Orthod 1966;52:804-22.
[PUBMED] |
| 14. | Burstone CJ, James RB, Legan H, Murphy GA, Norton LA. Cephalometrics for orthognathic surgery. J Oral Surg 1978;36:269-77.
[PUBMED] |
| 15. | Powell N, Humphreys B. Proportions of the Esthetic Face. New York: Thieme-Stratton; 1984.
|
| 16. | Burstone CJ. The integumental profile. Am J Orthod 1958;44:25.
|
| 17. | Arnett GW, Jelic JS, Kim J, Cummings DR, Beress A, Worley CM Jr, et al. Soft tissue cephalometric analysis: Diagnosis and treatment planning of dentofacial deformity. Am J Orthod Dentofacial Orthop 1999;116:239-53.
|
| 18. | Farkas LG, Kolar JC. Anthropometrics and art in the aesthetics of women′s faces. Clin Plast Surg 1987;14:599-616.
|
[Figure 1], [Figure 2], [Figure 3], [Figure 4], [Figure 5], [Figure 6]
[Table 1], [Table 2], [Table 3], [Table 4], [Table 5], [Table 6]
|


 Search Pubmed for