|
 
 |
| ORIGINAL ARTICLE |
|
| Year : 2015 | Volume
: 3
| Issue : 1 | Page : 30-37 |
|
Two-dimensional to three-dimensional: A new three-dimensional cone-beam computed tomography cephalometric analysis
Raghu Devanna
Department of Orthodontics, A.M.E's Dental College, Hospital and Research Center, Raichur, Karnataka, India
| Date of Web Publication | 29-Dec-2014 |
Correspondence Address:
Raghu Devanna
Department of Orthodontics, A.M.E's Dental College, Hospital and Research Center, Bijengera Road, Raichur - 584 103, Karnataka
India
 Source of Support: None, Conflict of Interest: None  | Check |
DOI: 10.4103/2321-3825.146356

Objectives of the Study: were (1) to develop a three-dimensional cephalometric analysis scheme applicable to assessing dentofacial deformities; and (2) to create a normative database of three-dimensional cephalometric measurements for adult North Karnataka population. Materials and Methods: A cross-sectional study was conducted on 40 male and 40 female adults with normal balanced facial profile and occlusion. Cone-beam computed tomography (CBCT) images obtained in digital imaging and communications in medicine format and the anatomic Cartesian three-dimensional cephalometric reference system according to Swennen et al. was used to standardize the reference planes. Cephalometric analysis was performed using various landmarks. New three-dimensional cephalometric analyses appropriate for orthognathic surgery as well as new parameters were used in this study. Results: The cephalometric norms generated in this study were comparable with those reported in the literature for conventional two-dimensional cephalometric analysis and unique features of North Karnataka population. The results showed significant differences between males and females in most of the facial measurements (P < 0.0001). Conclusion: This is the first database of three-dimensional cephalometric norms based on CBCT of the North Karnataka population. Norms generated were comparable with those reported in the literature with the conventional two-dimensional cephalometry: More accurate and reliable. Moreover, three-dimensional cephalometric analysis has the potential of incorporating new measurement methods that are difficult if not impossible in two-dimensional cepholmetric analysis. This method of cephalometric analyses can be useful in diagnosis and treatment planning for patients with dentofacial deformities. Keywords: Cone-beam computed tomography orthognathic surgery cephalometrics AMEAnalysis
How to cite this article:
Devanna R. Two-dimensional to three-dimensional: A new three-dimensional cone-beam computed tomography cephalometric analysis. J Orthod Res 2015;3:30-7 |
How to cite this URL:
Devanna R. Two-dimensional to three-dimensional: A new three-dimensional cone-beam computed tomography cephalometric analysis. J Orthod Res [serial online] 2015 [cited 2018 Sep 6];3:30-7. Available from: http://www.jorthodr.org/text.asp?2015/3/1/30/146356 |
| Introduction | |  |
Cephalometric analysis has been a key element in diagnosis and treatment planning for orthodontic and orthognathic surgery patients. However, errors in identification of landmarks, their projection in two dimensions, superimposition of anatomical structures, and implications relative to head orientation have raised questions about the reliability of the analyses. [1],[2] Therefore, several methods have been attempted to achieve a three-dimensional evaluation from the two-dimensional cephalographs. [3],[4],[5]
In recent times, several advantages of cone-beam computed tomography (CBCT) have been reported, including the ability to assess an image from the three planes, the ability to obtain life-sized three-dimensional images, and the lack of distortion or overlapping structures. [6] Moreover, it is not essential to make a fine adjustment of head position during imaging and analysis, because the points maintain their spatial relationships. [7] Some authors have reported ease of landmark identification and high precision of superimposing images with CBCT. [8],[9]
van Vlijmen et al. [10],[11] have reported clinically relevant differences between angular measurements taken from two-dimensional postero-anterior cephalographs and those from radiographs or three-dimensional models constructed from CBCT scans. Gribel et al. [12] concluded that measurements taken from a conventional lateral cephalogram were significantly different than those taken from a CBCT scan of the same person. Therefore, they presented a mathematical formula to enable the correction of two-dimensional into three-dimensional CBCT measurements.
Several investigators have attempted to develop three-dimensional analyses to cope with the huge amount of information provided by the three-dimensional technologies. Farronato et al. [13] proposed a 10-point three-dimensional analysis of CBCT images directly digitized on the rendered view. They evaluated the reliability and reproducibility of their method and compared their results to two-dimensional data. However, norms of the variables were not reported in their study, probably because of the small sample size and a wide range in age. Cheung et al. [14] have reported three-dimensional cephalometric norms on the basis of CBCT scans from a Chinese population. Bayome et al. [15] have reported an assessment of the relationships among the cephalometric variables and evaluated the curved nature of the mandible and maxilla. As there are no literature reports of the latter two with respect to North Karnataka population, the aim of this study were to assess three-dimensional cephalometric variables (with the inclusions of new parameters) from a normal occlusion sample and to evaluate the relationships among skeletal and dentoalveolar variables through a three-dimensional dephalometric analysis.
Objectives of the Study
- To develop a three-dimensional cephalometric analysis scheme applicable to assessing dentofacial deformities;
- To create a normative database of three-dimensional cephalometric measurements for adult North Karnataka population; and
- To evaluate the relationships among skeletal and dentoalveolar variables through a three-dimensional cephalometric analysis.
| Materials and Methods | | |
A total of 80 North Karnataka young adults (40 men and 40 women; 24.29 ± 2.4 years) with normal occlusion were recruited from the A.M.E's Dental College and Hospital (Raichur, India), and the patients reporting for the general dental checkup in the private practices (Raichur, India). Informed consent was obtained from all the individuals going through the CBCT study.
The inclusion criteria were as follows:
- Balanced facial appearance decided by agreement of two independent orthodontists;
- Class I skeletal relationship;
- Class I molar and canine relationship;
- Full permanent dentition with the exception of the third molars;
- 1- to 3-mm arch length discrepancy in each jaw;
- Normal curve of Spee of 0-2 mm;
- Absence of dental rotation;
- Coincidental facial and dental midlines;
- Absence of extensive restorations involving the proximal areas or the labial surfaces;
- No previous orthodontic treatment; and
- No acute or previous temporomandibular disorder.
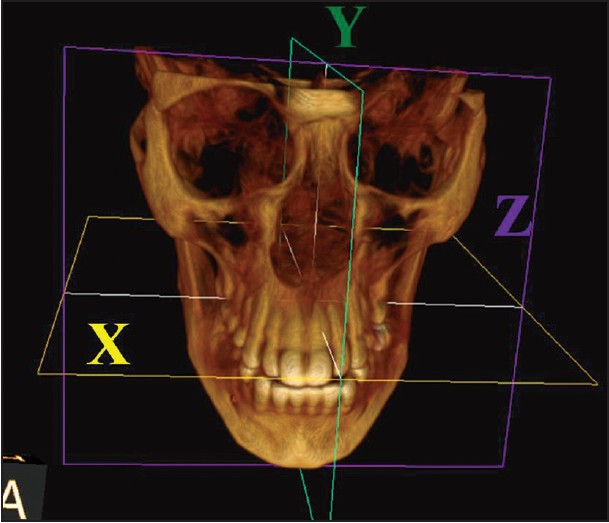
The CBCT scans were acquired with an iCAT (Imaging Sciences International LLC, 1910, North Penn Road, Hatfield PA-19440) CBCT scanner and data were provided by Insight CBCT machine (Insight CBCT Machine- Insight CBCT, Shivajinagar, Pune-411005 MH, India). Subjects were positioned such that the softtissue contours of their faces were included in the scan. The following settings were applied: Voxel size: 0.25 mm beam diameter: 16 cm × 13 cm, scan time: 26.9 s. The voxels were exported in the digital imaging and communications in medicine format. Invivo 5.1 (Anatomage, San Jose, CA, USA) software was used to reconstruct the voxels, view, digitize, and measure the CBCT scans. First, reorientation of the head position of each scan was performed. Nasion (N) was selected as the origin of the X, Y, and Z coordinates. The horizontal plane (X) was the plane passing through N and parallel to the plane defined through the right and left orbitales (Or) and the left porion (Po), while the midsagittal plane (Y) was defined as the perpendicular plane passing through the origin N and anterior nasal spines. The vertical plane (Z) was perpendicular to both X and Y passing through N [Figure 1].
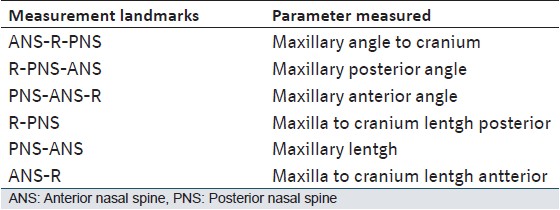
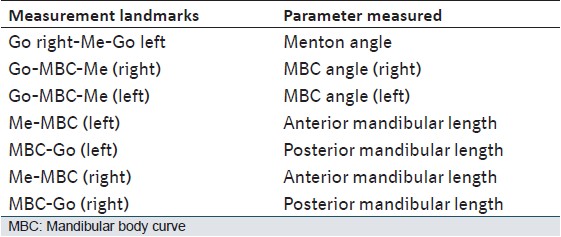
[Table 1] shows the definition of the hard- and softtissue landmarks digitized on the three-dimensional-rendered view of the images. The software calculated the linear and angular dimensions between certain landmarks, according to the definitions given in [Figure 2], [Figure 3], [Figure 4], [Figure 5], [Figure 6] and [Figure 7] and [Table 2],[Table 3],[Table 4] [Table 5] and [Table 6].
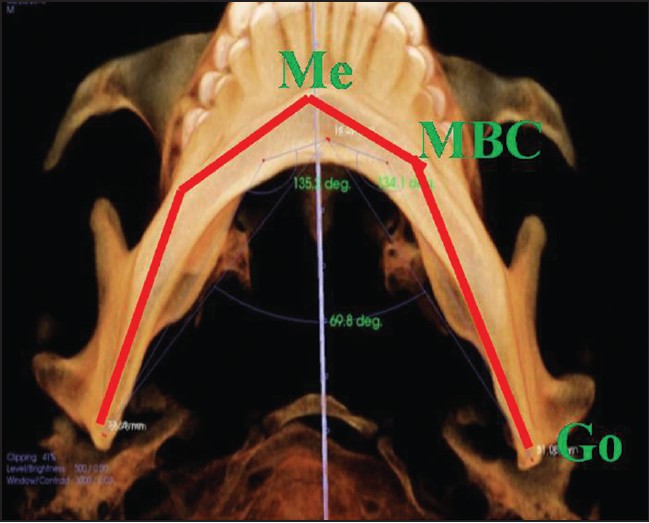
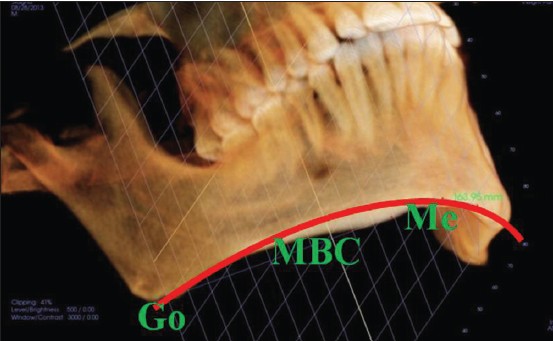
To calculate the mandibular body curve (MBC) length, the coordinates of the menton (Me) and the right and left gonion (Go) and MBC points, which lie on the most convex point on the curvature of the mandibular body midway between the inner and outer borders [Figure 7], were used. The 4 th -degree polynomial equation f(x) of the best fitting curve that passed through the 5-points was generated as an approximation of the curvature of the mandibular body.
f(x) = p1x 4 + p2x 3 + p3x 2 + p4x + ps (1)
It was found that the polynomial of the 4 th order approximated the curvature of the mandibular body with tolerable, or even negligible, mean square error.
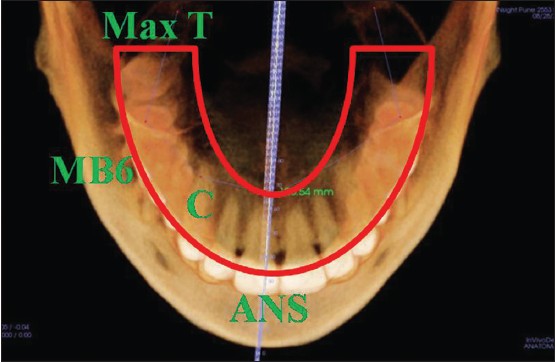
The same procedures were followed to calculate the length of the curve of the basal arch of the maxilla by incorporating the A point, right and left canine eminence, and maxillary tuberosity, where a and b in the equation are the values of X coordinates of A point and maxillary tuberosity, respectively [Figure 8].
Cephalomteric Analysis
Landmark identification performed by the same operator (D.G) twice at an interval of 7 days for ruling out the bias/Landmark Error.
Landmarks and reference planes were oriented at a standardized position: The anatomic Cartesian three-dimensional cephalometric reference system according to Swennen and Schutyser [16] [Figure 1].
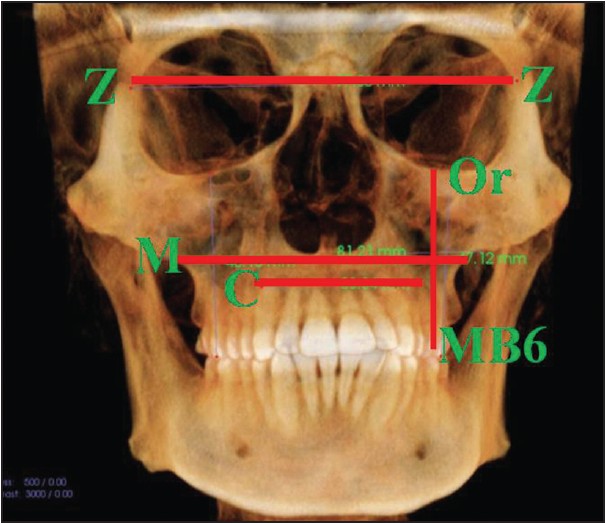
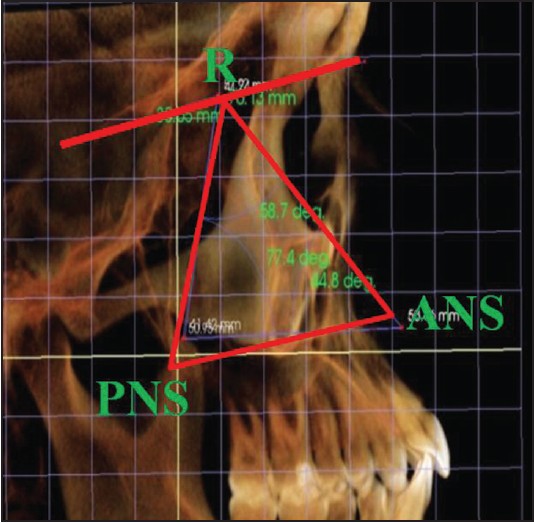
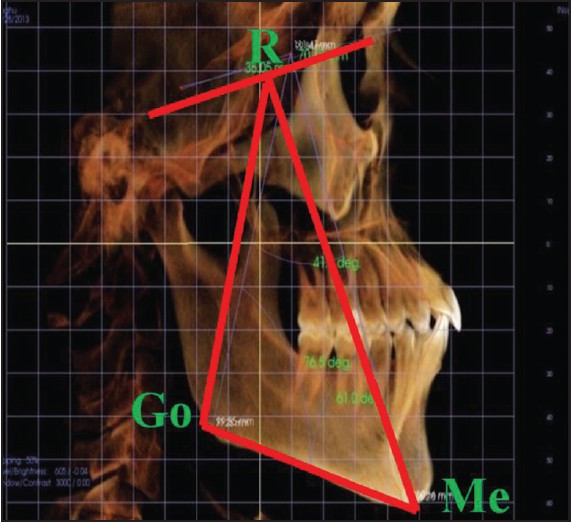
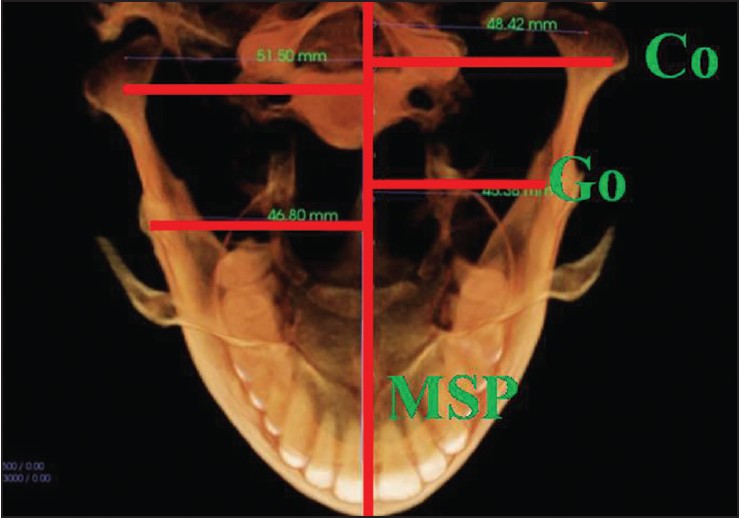
(1) Frontal view [Figure 2], (2) lateral view of maxilla [Figure 3], (3) lateral view of mandible [Figure 4], (4) posterior view of mandible [Figure 5], (5) mandibular body [Figure 6], (6) mandibular basal curve length [Figure 7], and maxillary basal curve length [Figure 8] were analyzed with the reference points as shown in respective figures and the values were calculated for both males and females samples to draw the statistical results.
Statistical Analysis
Statistical evaluation was performed using SPSS software version 16.0 (SPSS Inc., Chicago, IL, USA). Frequencies, means and standard deviations of all the linear and angular measurements were generated. Independent t-tests and one-way analysis of variance were used to analyze the gender- and age -related differences, respectively. Gender dimorphism was evaluated by an independent samples t-test. Correlations among skeletal and dentoalveolar measurements were calculated by means of Pearson's correlation coefficient. Correlations among liner and angular measurements by Karl Pearson's correlation coefficient method were performed.
To assess the reliability of the digitizing process, 10 CBCT scans were redigitized by the same operator, 2 weeks later. The intraclass correlation coefficient (ICC) between the duplicate measurements showed high reliability [ICC ranged between 0.997 and 0.931].
| Results | | |
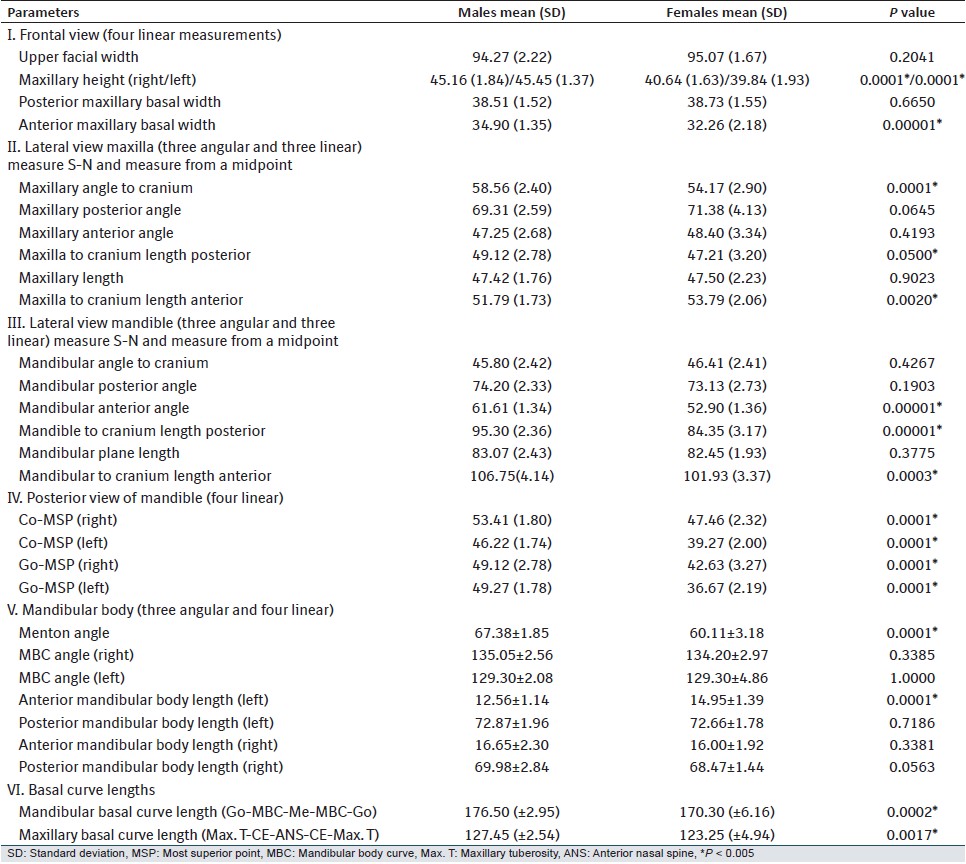
There were significant differences in skeletal and dentoalveolar variables between both the sexes. The results of maxillary frontal view showed a statistical significant variation in the maxillary height (right and left sides) in both genders. Statistically results showed males having more maxillary height than females. The maxillary anterior basal width also showed statistically significant increase in males as compared to females [Table 7], I. 2 and [Table 4].
On the lateral view of maxilla, the maxillary anterior angle showed a significant increase in males than females. In the same view, maxilla to cranium length anterior was more for females than males [Table 7], II. 5, 8, 9, and 10]. The results of lateral view of mandible showed statistically significant differences in the mandibular anterior angle with the females showing lesser prominence values then males. The mandibular cranium lengths both anterior and posterior were found to be more in males than females [Table 7], III. 13 and 14]. Statistical differences were evident in both condylar to midsagittal plane (right and left) and the Go -to-midsagittal plane (right and left) dimensions in both the genders [Table 7], IV]. The mandibular body showed statistically significant differences in Me angle and anterior mandibular body length (left) in both the sexes [Table 7], V. 21 and 24]. The basal curve of the mandible showed a longer curve length in male subjects (176.50 mm) than in female subjects (170.30 mm) (P < 0.002), but there was no significant difference in the maxillary basal curve length (P < 0.0017) [Table 7], VI].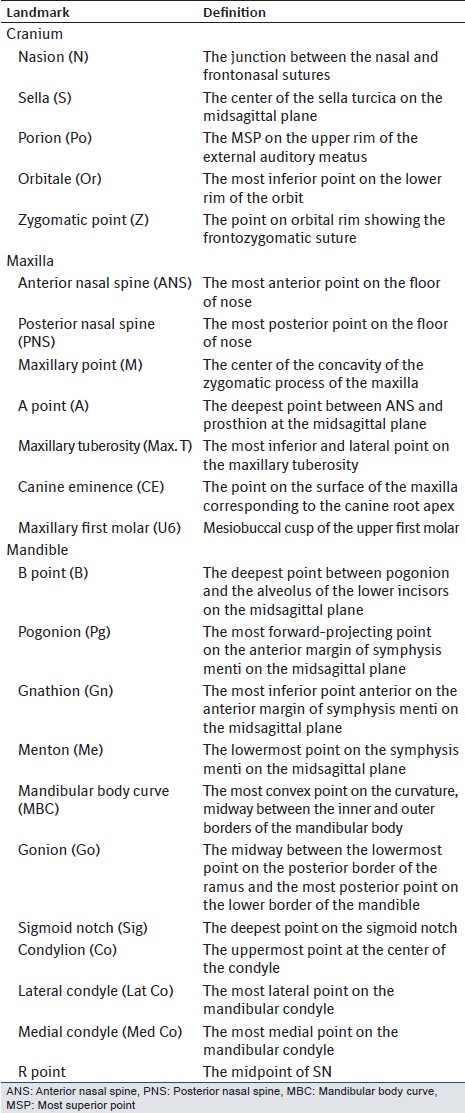 | Table 1: Definitions of the three-dimensional skeletal and dentoalveolar landmarks
Click here to view |
 | Table 3: Lateral view of maxilla (three angular and three linear) measure S-N and measure from a midpoint of SN
Click here to view |
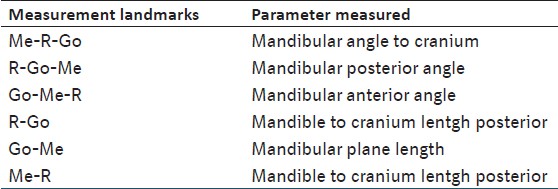 | Table 4: Lateral view mandible (three angular and three linear) measure S-N and measure from a midpoint of SN
Click here to view |
Correlations among liner and angular measurements by Karl Pearson's correlation coefficient method was performed and most of the values showed a significant correlation with r values >0.31 at 5% level of significance (P < 0.05).
| Discussion | | |
The three-dimensional evaluation of cephalometric variables assists clinicians in obtaining enhanced diagnosis and in treatment planning. Traditionally, two-dimensional cephalometric analyses suffer from inherent drawbacks related to the two-dimensional technique, which may have led to errors in their norms. Therefore, three-dimensional analysis may represent the key to overcoming these weaknesses.
Cheung et al. [16] evaluated the mandibular body length from Me to Antegonion and from Me to Go. However, they overlooked the assessment of the curved nature of the mandible and maxilla. Lee et al. [17] proposed the MBC point and reported a significant difference between the asymmetric and normal occlusion groups in the posterior mandibular body length, but this difference was not significant in the mandibular body length (Me-Go).
In our study, a new approach was applied to evaluate the curve length of the mandibular body by calculating the length of the curve passing through Me, MBC, and Go to achieve a more accurate representation of the length of the mandibular body instead of using an approximation of the curve with a line. The maxillary and mandibular curve lengths might guide clinicians in treatment planning by shedding light on the limits of the basal arches that enclose the teeth.
A previous study using three-dimensional analysis reported normal values of selected cephalometric variables, but no attempt was made to evaluate the relationships among these variables. [14] In our study, significant strong-to-moderate correlations of facial heights were noticed with several transverse variables, such as upper facial width and Go-to-midsagittal measurement as shown in [Table 7]. Moreover, the upper facial width had strong-to-moderate correlations with the maxillary height and length and MBC length. These findings may suggest the existence of relationships among facial dimensions in the normal occlusion sample.
Regarding the condyle, You et al. [18] suggested that the condylar unit, consisting of condyle, condylar neck, and part of the ramus, plays a central role in mandibular asymmetry, whereas Huntjens et al. [19] found condylar asymmetries did not correlate well with facial asymmetry. In our study, the reported correlation between the condylar and mandibular variables might be attributed to the adaptive capacity of the condyle, as suggested by Enlow and Hans. [20] For example, in [Table 7], IV 17 and 18, the negative correlation between the condylar anteroposterior inclination and the gonial angle tends to preserve the proportion between the height of the mandible and its sagittal position in the normal occlusion population.
Recently, the difference in ramal length from one side to the other was reported as a characteristic of both mandibular-retrusion and prognathism groups. [21]
In our results, there was no significant difference between the right and left sides. However, Shah and Joshi [22] reported asymmetry in the normal occlusion population with pleasing facial features. This discrepancy might be the result of difficulties in landmark identification in their study, due to superimposition of anatomical structures.
In our study, the comparison between male and female subjects showed significant differences in several vertical and transverse measurements, but there were no significant differences in the sagittal dimensions. These results were in agreement with Thilander et al. [23] who reported that the linear craniofacial measurements were larger in male subjects than in female subjects, while angular measurements showed no statistical differences. The anterior mandibular length was found to be more in males than in females confirming the more prominent chin in males. On the contrary, the results of our study confirmed that the females of North Karnataka region have increased length of maxillary anterior to the cranial base, which was evident clinically as a gummy smile. These findings are of clinical importance when any orthognathic surgery is performed to match with the normal facial preferences for a particular ethnic group. This might suggest that the dimensions of the face played a major role in the gender dimorphism.
We limited our subject base to young adults to eliminate the effect of growth, because changes in facial features by age have been reported. [23],[24] In addition, our method used for digitization of the CBCT images might be technique sensitive. Further studies are recommended to evaluate the operator learning curve; the reliability of the measurements, the predictors of the correlated variables, and norms for different ethnic groups. The three-dimensional evaluation of cephalometric variables assists clinicians in obtaining enhanced diagnosis and treatment planning. Three-dimensional analysis overcomes drawbacks/weaknesses of the two-dimensional analysis. This is the first three-dimensional cephalometric analysis for the North Karnataka population. This analysis/database will be a useful reference for evaluation of the Indian facial form. This database will also be of value for orthodontist and oral and maxillofacial surgeons in India. These normal values could be used as a reference for assessing dysmorphology and evaluating treatment outcomes in young adults. 20-30 years age range: Sample recruited comparable to age of patients likely to have orthognathic surgery. By limiting age range-possibility of aging differences were ruled out. SN plane; most superior point plane; FH plane and zero meridian plane were used for facial orientation. Linear/mill metric measurements should not be used exclusively for the clinical diagnosis and treatment planning and for comparing results and treatment outcome. Angular/ratios/differences between two linear measurements are more acceptable of reflecting the harmony or any discrepancy of facial features. It can be very useful and accurate for comparing results and treatment outcome. Hence, the angular measurements, ratios and differences in linear measurements (e.g., asymmetric ramus length) in our analysis are of great help for the planning of orthognathic surgery and treatment outcome.
Limitation of the Study
Artifacts in the CBCT by dental amalgam fillings or bridges may interfere with the analysis of molar regions.
Softtissue analysis is not included and requires virtual three-dimensional model set up.
| Conclusion | | |
A new three-dimensional CBCT cephalometric analysis scheme applicable to assessing dentofacial deformities is developed. This is the first database of three-dimensional cephalometric norms generated based on CBCT of the North Karnataka population.
Norms generated were comparable with those reported in the literature with the conventional two-dimensional cephalometry: More accurate and reliable. Moreover, three-dimensional cephalometric analysis has the potential of incorporating new measurement methods that are difficult if not impossible in two-dimensional cepholmetric analysis.
Strong-to-moderate correlation values were found among several vertical and transverse variables through three-dimensional cephalometric analysis. This method of cephalometric analyses can be useful in diagnosis and treatment planning for patients with dentofacial deformities.
| References | | |
| 1. | Baumrind S, Frantz RC. The reliability of head film measurements. 1. Landmark identification. Am J Orthod 1971;60:111-27.  |
| 2. | Ahlqvist J, Eliasson S, Welander U. The cephalometric projection. Part II. Principles of image distortion in cephalography. Dentomaxillofac Radiol 1983;12:101-8. |
| 3. | Kusnoto B, Evans CA, BeGole EA, de Rijk W. Assessment of 3-dimensional computer-generated cephalometric measurements. Am J Orthod Dentofacial Orthop 1999;116:390-9. |
| 4. | Rousset MM, Simonek F, Dubus JP. A method for correction of radiographic errors in serial three-dimensional cephalometry. Dentomaxillofac Radiol 2003;32:50-9. |
| 5. | Nakasima A, Terajima M, Mori N, Hoshino Y, Tokumori K, Aoki Y, et al. Three-dimensional computer-generated head model reconstructed from cephalograms, facial photographs, and dental cast models. Am J Orthod Dentofacial Orthop 2005;127:282-92. |
| 6. | Ludlow JB, Gubler M, Cevidanes L, Mol A. Precision of cephalometric landmark identification: Cone-beam computed tomography vs conventional cephalometric views. Am J Orthod Dentofacial Orthop 2009;136:312.e1-10. |
| 7. | Ludlow JB, Laster WS, See M, Bailey LJ, Hershey HG. Accuracy of measurements of mandibular anatomy in cone beam computed tomography images. Oral Surg Oral Med Oral Pathol Oral Radiol Endod 2007;103:534-42. |
| 8. | Cevidanes LH, Bailey LJ, Tucker GR Jr, Styner MA, Mol A, Phillips CL, et al. Superimposition of 3D cone-beam CT models of orthognathic surgery patients. Dentomaxillofac Radiol 2005;34:369-75. |
| 9. | Cevidanes LH, Bailey LJ, Tucker SF, Styner MA, Mol A, Phillips CL, et al. Three-dimensional cone-beam computed tomography for assessment of mandibular changes after orthognathic surgery. Am J Orthod Dentofacial Orthop 2007;131:44-50. |
| 10. | van Vlijmen OJ, Maal TJ, Bergé SJ, Bronkhorst EM, Katsaros C, Kuijpers-Jagtman AM. A comparison between two-dimensional and three-dimensional cephalometry on frontal radiographs and on cone beam computed tomography scans of human skulls. Eur J Oral Sci 2009;117:300-5. |
| 11. | van Vlijmen OJ, Bergé SJ, Bronkhorst EM, Swennen GR, Katsaros C, Kuijpers-Jagtman AM. A comparison of frontal radiographs obtained from cone beam CT scans and conventional frontal radiographs of human skulls. Int J Oral Maxillofac Surg 2009;38:773-8. |
| 12. | Gribel BF, Gribel MN, Manzi FR, Brooks SL, McNamara JA Jr. From 2D to 3D: An algorithm to derive normal values for 3-dimensional computerized assessment. Angle Orthod 2011;81:3-10. |
| 13. | Farronato G, Garagiola U, Dominici A, Periti G, de Nardi S, Carletti V, et al. "Ten-point" 3D cephalometric analysis using low-dosage cone beam computed tomography. Prog Orthod 2010;11:2-12. |
| 14. | Cheung LK, Chan YM, Jayaratne YS, Lo J. Three-dimensional cephalometric norms of Chinese adults in Hong Kong with balanced facial profile. Oral Surg Oral Med Oral Pathol Oral Radiol Endod 2011;112:e56-73. |
| 15. | Bayome M, Park JH, Kook YA. New three-dimensional cephalometric analyses among adults with a skeletal Class I pattern and normal occlusion. Korean J Orthod 2013;43:62-73. |
| 16. | Swennen GR, Schutyser F. Three-dimensional cephalometry: Spiral multi-slice vs cone-beam computed tomography. Am J Orthod Dentofacial Orthop 2006;130:410-6. |
| 17. | Lee H, Bayome M, Kim SH, Kim KB, Behrents RG, Kook YA. Mandibular dimensions of subjects with asymmetric skeletal class III malocclusion and normal occlusion compared with cone-beam computed tomography. Am J Orthod Dentofacial Orthop 2012;142:179-85. |
| 18. | You KH, Lee KJ, Lee SH, Baik HS. Three-dimensional computed tomography analysis of mandibular morphology in patients with facial asymmetry and mandibular prognathism. Am J Orthod Dentofacial Orthop 2010;138:540.e1-8. |
| 19. | Huntjens E, Kiss G, Wouters C, Carels C. Condylar asymmetry in children with juvenile idiopathic arthritis assessed by cone-beam computed tomography. Eur J Orthod 2008;30:545-51. |
| 20. | Enlow DH, Hans MG. Essentials of Facial Growth. Philadelphia: W.B. Saunders; 1996. p. 72. |
| 21. | Kim EJ, Palomo JM, Kim SS, Lim HJ, Lee KM, Hwang HS. Maxillofacial characteristics affecting chin deviation between mandibular retrusion and prognathism patients. Angle Orthod 2011;81:988-93. |
| 22. | Shah SM, Joshi MR. An assessment of asymmetry in the normal craniofacial complex. Angle Orthod 1978;48:141-8. [ PUBMED] |
| 23. | Thilander B, Persson M, Adolfsson U. Roentgen-cephalometric standards for a Swedish population. A longitudinal study between the ages of 5 and 31 years. Eur J Orthod 2005;27:370-89. |
| 24. | Shaw RB Jr, Kahn DM. Aging of the midface bony elements: A three-dimensional computed tomographic study. Plast Reconstr Surg 2007;119:675-81. |
[Figure 1], [Figure 2], [Figure 3], [Figure 4], [Figure 5], [Figure 6], [Figure 7], [Figure 8]
[Table 1], [Table 2], [Table 3], [Table 4], [Table 5], [Table 6], [Table 7]
| This article has been cited by | | 1 |
Cone-Beam Computed Tomography-Based Three-Dimensional McNamara Cephalometric Analysis |
|
| Rodrigo Mologni Gonçalves dos Santos,José Mario De Martino,Francisco Haiter Neto,Luis Augusto Passeri | | Journal of Craniofacial Surgery. 2018; 29(4): 895 | | [Pubmed] | [DOI] | | | 2 |
Cone beam computed tomography-based cephalometric norms for Brazilian adults |
|
| R.M.G. Santos,J.M. De Martino,F. Haiter Neto,L.A. Passeri | | International Journal of Oral and Maxillofacial Surgery. 2017; | | [Pubmed] | [DOI] | | | 3 |
Effect of Head Position on Maxillofacial Transverse Measurements Made on the Skull and Cone Beam Computed Tomography Scans |
|
| Abbas Shokri,Amirfarhang Miresmaeili,Nasrin Farhadian,Sepideh Falah-kooshki,Payam Amini,Najmeh Mollaie | | Brazilian Dental Journal. 2016; 27(5): 604 | | [Pubmed] | [DOI] | |
|


 |
|
|
|


 Search Pubmed for