|
 
 |
| ORIGINAL ARTICLE |
|
| Year : 2015 | Volume
: 10
| Issue : 4 | Page : 123-127 |
|
Evaluating the quality of multiple-choice questions used for final exams at the Department of Internal Medicine, College of Medicine, King Khalid University
Omer A Elfaki1, Khalid A Bahamdan1, Suliman Al-Humayed2
1 Department of Medical Education; Internal Medicine, College of Medicine, King Khalid University, Abha, Kingdom of Saudi Arabia
2 Department of Internal Medicine, College of Medicine, King Khalid University, Abha, Kingdom of Saudi Arabia
| Date of Web Publication | 15-Dec-2015 |
Correspondence Address:
Omer A Elfaki
Department of Medical Education, College of Medicine, King Khalid University, P.O. Box: 641, Abha 61421
Kingdom of Saudi Arabia
  | Check |
DOI: 10.4103/1858-5000.171863 
Background: The multiple-choice questions (MCQs) part of the final exam in internal medicine at the College of Medicine, King Khalid University is composed of 100 questions of the one best answer type with four options. Although some basic forms of item analysis have been carried out by the department of internal medicine before, the data generated has not been used regularly to assess the quality of the questions or for feedback for the purpose of quality improvement. Aim: The aim of this study was to assess the quality of MCQs used in the final exam in internal medicine during the 1st week of January 2013. Methods: The total number of the students of this batch was 58, and the total number of MCQs was 100. Item analysis was done using Microsoft Excel 2007. The parameters obtained included difficulty index, discrimination index, point biserial correlation, and reliability of the exam using Kuder-Richardson formula (KR-20), in addition to analysis of distractors.Results: The mean difficulty of the questions was 0.55 (STD = 0.2) and the mean discrimination index was 0.24 (STD = 0.2) with 41 questions having values below 0.20. Regarding point biserial correlation, the mean was 0.16 (STD = 0.12). KR-20 was found to be 0.79; indicating good reliability and the student scores were believed to be reliable. From the 300 distractors assessed, 41% were nonfunctioning. The mean number of functioning distractors per item was 1.76. Conclusion: The MCQs exam was quite reliable, and the difficulty of the questions was reasonable. The discrimination power of most of the questions was acceptable; however, a relatively high proportion of the questions had unacceptable discrimination index values.
Keywords: Difficulty index, discrimination index, distractors, point biserial correlation
How to cite this article:
Elfaki OA, Bahamdan KA, Al-Humayed S. Evaluating the quality of multiple-choice questions used for final exams at the Department of Internal Medicine, College of Medicine, King Khalid University. Sudan Med Monit 2015;10:123-7 |
How to cite this URL:
Elfaki OA, Bahamdan KA, Al-Humayed S. Evaluating the quality of multiple-choice questions used for final exams at the Department of Internal Medicine, College of Medicine, King Khalid University. Sudan Med Monit [serial online] 2015 [cited 2018 Sep 5];10:123-7. Available from: http://www.sudanmedicalmonitor.org/text.asp?2015/10/4/123/171863 |
| Introduction | |  |
The multiple-choice questions (MCQs) are the most common type of written test items used in undergraduate, graduate, and postgraduate medical education.[1] They can be used to assess a broad range of knowledge in a short time.[2] Thus, a wide coverage of content can be tested reliably with MCQs allowing for good test reliability.[3] If the content is well represented, MCQs also allow for a high degree of test validity. It is believed by some that MCQs are not suitable for testing high cognitive levels.[4] However, this sort of criticism is thought to be due to bad construction rather than to inherent weakness of the MCQs. Appropriately, constructed MCQs result in objective testing that can measure knowledge, comprehension, application, and analysis.[5] Disadvantages of MCQs are that they test recognition (choosing an answer) rather than constructing an answer, they allow for guessing, and they are difficult and time-consuming to construct. To assess the quality of MCQs, item analysis is used. This is the process of collecting, summarizing, and using information from students' responses to evaluate the items and the test.[6] The parameters computed include item difficulty, item discrimination, point biserial correlation, and coefficient of reliability. To complete the evaluation distractor analysis is done.
To calculate the difficulty of an item, the number of persons who answered it correctly is divided by the total number of the persons who answered it. Usually, this proportion is indicated by the letter P, which indicates the difficulty of the item.[7] P is an important parameter which help evaluate the standard of MCQs used in an examination. P is important because it reveals whether an item is too easy or too hard. In either case, the item may add to the unreliability of the test because it does not aid in differentiating between those students who know the material and those who do not. The optimal item difficulty depends on the question type and on the number of possible distractors.[7]
Discrimination index (D) is considered a good parameter for assessment of the quality of MCQs used in an examination, with abnormal values indicating poor quality. If the test and an item measure the same ability or competence, we would expect that those having a high overall test score would have a high probability of being able to answer the item. We would also expect the opposite, which is to say that those having low test scores would have a low probability of answering the item correctly. Thus, D measures the difference between the percentage of students in the upper group (PU), i.e., the top 27% scorers, who obtained the correct response, and the percentage of those in the lower group (PL), i.e., the bottom 27% scorers, who obtained the correct response.[8] A good item should discriminate successfully between those who score high on the test and those who score low.[9] The greatest value of D lies in its ability to identify questions which are discrepant in some way with respect to other questions on the exam and must not be used in an absolute way. The sources of the discrepancy are potentially many and need to be interpreted by the examiners.[10] A negative value suggests that the students in the upper group were misled by an ambiguity that the students in the lower group, and the item writer, failed to discover relevant information. The point Biserial (rPB) correlation is used to find out if the right students are getting the items right, and how much predictive power the item has and how it would contribute to predictions. It is suggested that rPB tells more about the predictive validity of the total test.[11] It is further suggested that rPB is a combined measure of item-criterion relationship and of difficulty level.
Kuder-Richardson formula (KR-20) is a reliability coefficient. It reflects the internal consistency of the test. KR-20 values of 0.8 or higher are considered good reliability. Unsatisfactorily low KR-20s could result from an excess of very difficult or very easy items and items with low discrimination indices.
A distractor analysis addresses the performance of those incorrect response options. For a distractor (wrong option) to be useful, it should represent a common misconception among students about the correct answer. The plausibility of distracters is a high priority.[12] However, writing plausible distractors is time-consuming and the most difficult part of the construction of MCQs. Some of the main flaws in MCQs writing include implausible distracters. A distractor is considered nonfunctioning if it is selected infrequently (<5%) by examinees. A good distractor looks like a right answer but is not. At least one distractor should be obviously wrong, so a student who knows something will have an increased chance of guessing the right answer by process of elimination. The other distractors should be reasonable responses, but clearly incorrect to someone who understands the material. The other distractors may, in fact, be true statements, but not relevant to understanding the question being asked.
Some basic forms of item analysis have been carried out routinely by the department of internal medicine like all other departments in the college of medicine, King Khalid University (KKU), but the data generated has not been used regularly to assess the quality of the questions or for feedback for the purpose of quality improvement. In fact, the automatically generated analysis had not been useful because of the division of each class into four modules.
The purpose of this study was to investigate the quality of MCQs used as part of the assessment of final year medical students in internal medicine in the college of medicine, KKU. Both quantitative and qualitative parameters for individual items and the whole examination were used. These included p, D, rPB, r, and distractor effectiveness.
| Methods | | |
In this cross-sectional study, MCQs was taken from the summative assessment test paper of internal medicine for graduating students in January 2013. A total of 100 test items were used. The MCQs items were written by individual teachers and vetted at the department of internal medicine by the examination committee for item clarity, accuracy, content, and structure. All of the items were type A MCQs consisting of a stem and four choices, and the students were to select one best answer from these four choices. A correct answer was awarded one mark, and there were no negative marks for the incorrect answers. Microsoft Excel 2007 was used to perform item analysis. Responses obtained by the individual student on each of the MCQs items were analyzed. All the 58 students attempted all the questions. P, D, rPB, and KR-20 were computed. P was defined as the proportion of examinees answering the item correctly. It was calculated for each item according to the formula:
P = R/T where R is the number of examinees who answered the item correctly, and T is the total number of examinees who took that test.
The mean difficulty of the exam was also calculated by taking the average of all item difficulty indices. D was calculated by ranking the students according to the total score and then selecting the top 27% and the lowest 27% in terms of total score. D was determined using the formula D = (UG − LG)/n (number of students). Based on Ebel's (1972) guidelines on classical test theory item analysis, items were categorized in their discrimination indices Excellent (D<0.39), good (D>0.3 and ≤0.39), moderate (D>0.2 and ≤ 0.29), poor (D>0.01 and ≤0.2), worst (D<0.01).
In addition, distractor analysis was done. A distractor was considered nonfunctioning (NFD) if it was selected by <5% of students. Frequency distribution was constructed for the 100 items, which included 300 options (300 distractors and 100 correct responses). All distractors with a choice frequency of <5% were identified. Items with 0, 1, 2, and 3 NDFs were also identified.
| Results | | |
[Table 1] shows the distribution of the questions among the ranges of difficulty index values for the 100 items included in the test. Items were classified as very difficult (ρ ≤ 0.20), moderately difficult (ρ > 0.20 and ≤0.40), intermediately difficulty (ρ > 0.40 and ≤0.60), moderately easy (ρ > 0.60 and ≤0.80), or very easy (ρ > 0.80). The highest number of questions (27) fall in the difficulty index ranges 0.61–0.80 while 25 items fall in the range 0.41–0.60. The mean difficulty of the test was found to be 0.55 (STD = 0.2).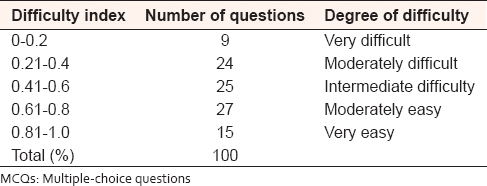 | Table 1: The distribution of the MCQs among the different ranges of difficulty indices
Click here to view |
[Table 2] represents the distribution of the 100 MCQs among the different ranges of discrimination index values. The highest numbers of questions (25) fall in the D range group 0.2–0.29. Twenty-three questions had ≤0.09 discrimination indices.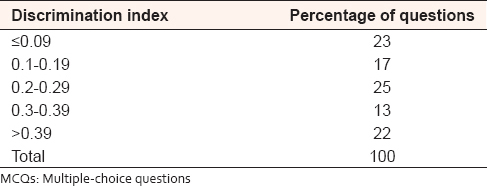 | Table 2: The distribution of the MCQs among the different ranges of discrimination indices
Click here to view |
In [Figure 1], rPB range values and the distribution of the question among them was presented. 44% of the items had ≥0.2.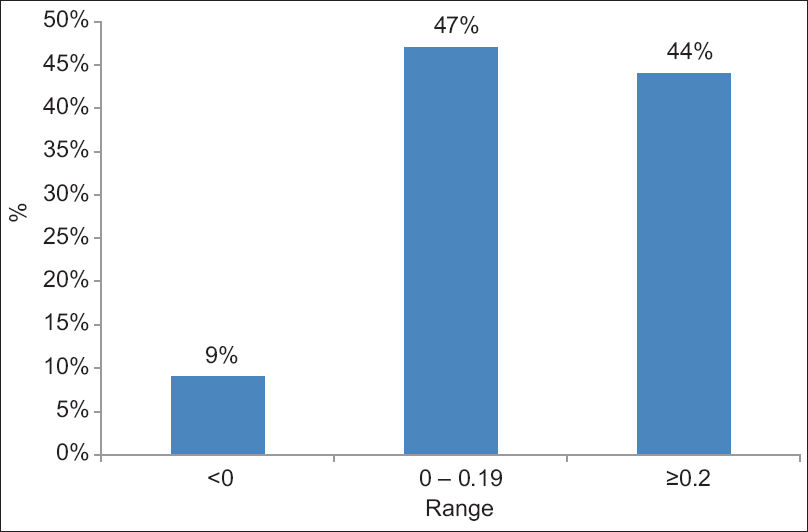 | Figure 1: The distribution of the multiple-choice questions among the different ranges of rPB
Click here to view |
In [Table 3], the total number of distractors assessed were 300 (3 per item) out of which 124 (41%) were NFDs. DE was 59%. Seventy-four percent of the items had NFDs, while in (26%) of the items all the distracters were effective. The distribution of NFDs per item is shown in [Table 4]. Sixty three percent had one or two NFDs while 11% of the items had three NFDs. The mean number of functioning distractors per item was 1.76. Determination of Kuder-Richardson formula yield a figure of 0.79.
| Discussion | | |
In general, for tests that are intended to differentiate among students, maximum differentiation can be achieved in tests of moderate difficulty (i.e., the difficulty index is 50–80%).[8] The distribution of the difficulty indices of items came very close to what is desirable, covering practically the whole range of P values. Difficulty indices of most of the items were considered quite acceptable since 76% of the questions lie in the acceptable difficulty index values
of 0.21–0.80.[13] On the other hand, since the purpose of the test was to show students' levels of content mastery, the 15 items observed to be with high P values were expected and ensured that the content area covered by them was mastered by most of the students.[14] The questions with difficulty indices ≤0.20 were very difficult and were not acceptable. These represent 9% of the total questions included in the exam. Up to 5% of questions in a test is required to be very difficult for a balanced test.[14]
Since the minimum acceptable threshold of discrimination index adopted was 0.20, 60% of the exam questions had passed the criteria of the parameter of discrimination index. In fact, 35% of the total questions are classified as with good or excellent discrimination index. It has been reported that any discrimination index of 0.2 or higher is acceptable.[15] The 40% of the questions falling below the acceptable level of 0.2 D were not acceptable and a source of concern. The 17% questions in the D range 0.01–0.19 discriminate poorly, and they needed a careful review for the presence of item flaws in order to improve their ability to discriminate. Such questions could be either flawed or particularly susceptible to guessing. The 23 questions falling below 0.01 D value needed careful review and were candidates for elimination. The average D for all the items was 0.24 (STD = 0.2). Regarding rPB, 44% of the items were considered of good quality while 47% of the items need to be reviewed. In 9% of the items, rPB was negative, and all of them have to be eliminated [Figure 1].{Figure 1}
Based on the criteria of <5% of students selection, Haladyna and Downing [16] found that over 38% of distractors in 477 items on four MCQ options were NFDs and were therefore eliminated. Comparatively, NFDs in the present study were 41% indicating a slightly higher rate. In the same study,[15] the percentage of items with 3 FDs (in 4 options items) ranged from only 1.1–8.4% of all items while in this study it was 26% indicating a better quality. In another study, only 13.8% of all items had three functioning distracters (4 option type).[17] It is interesting that Haladyna and Downing found none of the five-option items had four functioning distracters. For a distractor to be functioning, it has to be plausible. In fact, NFDs are considered as just fillers that only increase the number of options. However, what really matters is the quality of the distractors, not the number.[18] In a meta-analysis of 80 years of research on the number of options in MCQs, it had been concluded that three options was optimal for MCQs in most settings.[19]
| Conclusion | | |
The difficulty indices for the 100 MCQs exam for 58 medical students were calculated and found to be acceptable. Based on this parameter, the exam was considered to be of good quality. Regarding the discrimination indices, most of the questions were of acceptable quality and few of them needed improvement. The quality of distracters is comparable to those reported from similar tests. Some of the items with NFDs need to be revised. The results of the analysis should be effectively used for feedback to students and staff to improve the quality of learning, teaching, and future assessment.
Financial support and sponsorship
Nil.
Conflicts of interest
There are no conflicts of interest.
| References | | |
| 1. | Farley JK. The multiple-choice test: Writing the questions. Nurse Educ 1989;14:10-2.  |
| 2. | Considine J, Botti M, Thomas S. Design, format, validity and reliability of multiple choice questions for use in nursing research and education. Collegian 2005;12:19-24. |
| 3. | Skakun EN, Nanson EM, Kling S, Taylor WC. A preliminary investigation of three types of multiple choice questions. Med Educ 1979;13:91-6. [ PUBMED] |
| 4. | Schuwirth LW, van der Vleuten CP. Different written assessment methods: What can be said about their strengths and weaknesses? Med Educ 2004;38:974-9. |
| 5. | Kemp JE, Morrison GR, Ross SM. Developing evaluation instruments. In: Designing Effective Instruction. New York: J MacMillan College Publishing Company; 1994. p. 180-213. |
| 6. | Kehoe J. Basic item analysis for multiple choice tests. Pract Assess J Res Eval 1995;4:10. |
| 7. | Crocker L, Algina J. Introduction to Classical and Modern Test Theory. New York: Holt, Rinehart and Winsto; 1986. |
| 8. | |
| 9. | Abdel-Hameed AA, Al-Faris EA, Alorainy IA, Al-Rukban MO. The criteria and analysis of good multiple choice questions in a health professional setting. Saudi Med J 2005;26:1505-10. |
| 10. | |
| 11. | |
| 12. | Gronlund NE, Linn RL. Measurement and Evaluation in Teaching. 6 th ed. New York: Macmillan; 1960. |
| 13. | |
| 14. | Backhoff E, Larrazolo N, Rosas M. The level of difficulty and discrimination power of the Basic Knowledge and Skills Examination (EXHCOBA). Electronic Journal of Educational Research 2012;2. Availible from: http://redie.uabc.mx/vol2no1/contents-backhoff.html. [Last retrieved on 2012 Mar 2]. |
| 15. | Ebel RL. Essentials of Educational Measurement. 1 st ed. New Jersey: Prentice Hall; 1972. |
| 16. | Haladyna TM, Downing SM. How many options is enough for a multiple-choice test item? Educ Psychol Meas 1993;53:999-1010. |
| 17. | Tarrant M, Ware J, Mohammed AM. An assessment of functioning and non-functioning distractors in multiple-choice questions: A descriptive analysis. BMC Med Educ 2009;9:40. |
| 18. | Haladyna TM, Downing SM. Validity of a taxonomy of multiple-choice item-writing rules. Appl Meas Educ 1989;2:51-78. |
| 19. | Rodriguez MC. Three options are optimal for multiple-choice items: A meta-analysis of 80 years of research. Educ Meas Issues Pract 2005;24:3-13. |
[Figure 1]
[Table 1], [Table 2], [Table 3], [Table 4]
|


 Search Pubmed for