- Institution: Stanford Univ Med Ctr Lane Med Lib/Periodical Dept/Rm L109
- Sign In as Member / Individual
S-Nitrosylation Signaling in Cell Biology
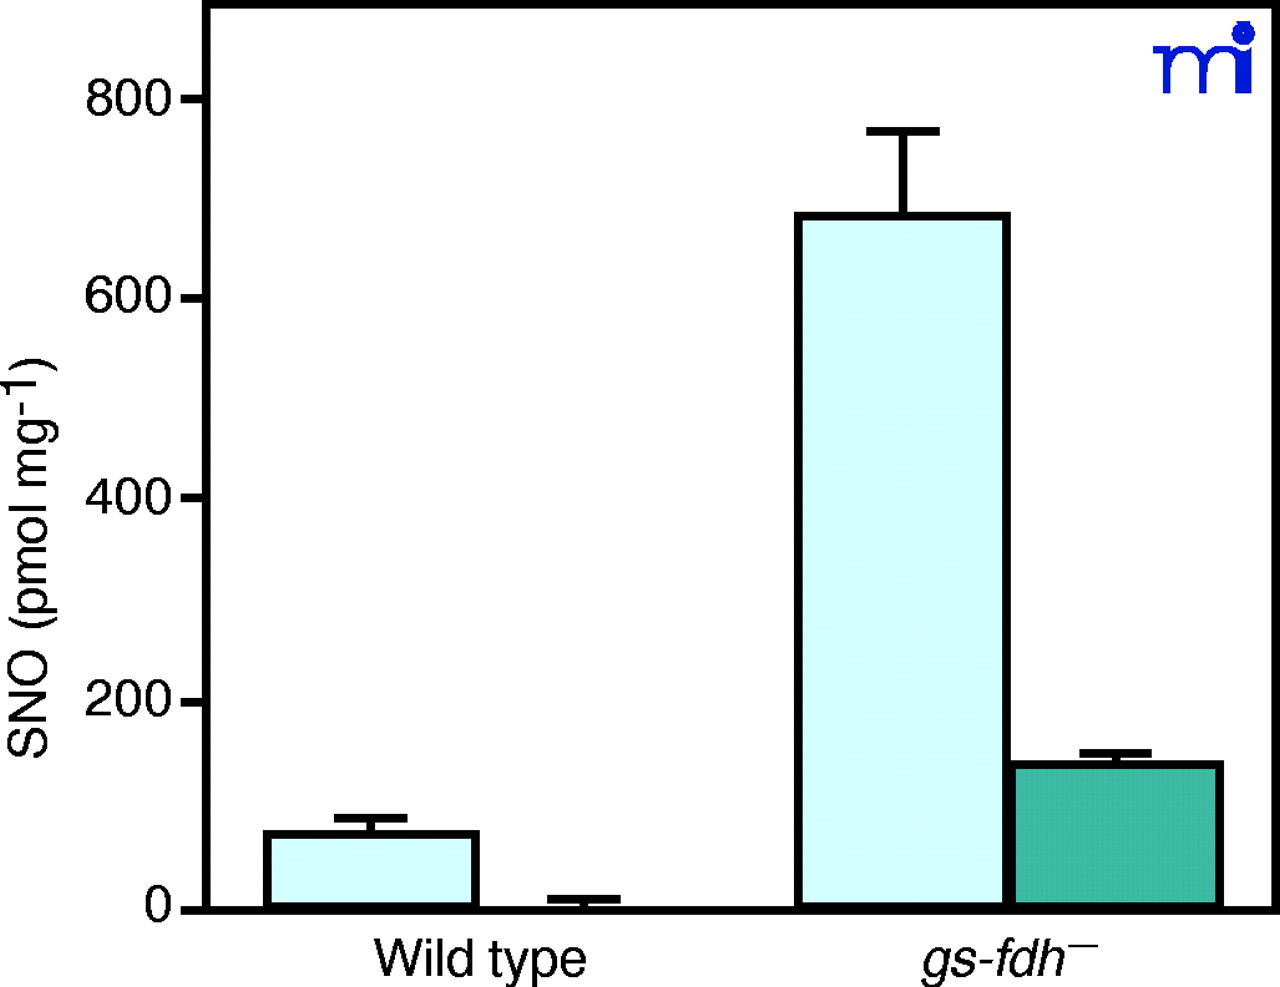
Figure 1.
Increased levels of intracellular S-nitrosothiols in gs-fdh— mutant cells after GSNO treatment. Mid-log phase (absorbance 600 nm = 0.4–0.6) cells were cultured in the presence of 5 mM GSNO at 30°C for 2 h. SNO signal in the whole lysate (light blue bars) and the fraction that passed through a 5K cut-off membrane (dark blue bars) were normalized against whole cell lysate protein content. Reprinted with permission (30).

