|
 
 |
| TECHNICAL REPORT |
|
| Year : 2014 | Volume
: 2
| Issue : 1 | Page : 15-29 |
|
National human immunodeficiency virus and acquired immunodeficiency syndrome and Reproductive Health Survey 2012 (plus II): Human immunodeficiency virus Testing
Federal Ministry of Health (Nigeria)
Federal Republic of Nigeria, Federal Ministry of Health, Abuja, Nigeria
| Date of Acceptance | 10-Jun-2014 |
| Date of Web Publication | 1-Jul-2014 |
Correspondence Address:
Federal Ministry of Health (Nigeria)
Federal Ministry of Health, Federal Republic of Nigeria, Federal Ministry of Health Abuja
Nigeria
 Source of Support: None, Conflict of Interest: None  | Check |
DOI: 10.4103/2321-9157 .135744

Background: The 2012 National Human Immunodeficiency Virus (HIV) and Acquired Immunodeficiency Syndrome (AIDS) and Reproductive Health Survey (NARHS Plus II) was a nationally representative survey carried out to provide information on key HIV and AIDS and reproductive health knowledge and behavior-related issues. The survey included a second wave of the biological marker component (HIV testing) and was called NARHS Plus II. The major objective of NARHS Plus is to obtain accurate HIV prevalence estimates and information on behavioral and other risk factors-related to HIV infection at the national, zonal and to some extent the state levels. Survey Method: Data collection took place between September and December 2012 from a total of 32,543 households (rural = 22,192 and urban = 10,351). The 31,235 individual respondents interviewed in NARHS Plus II; consisting of 15,596 males and 15,639 females showed a response rate of 88%. The mean age of female respondents was 29.2 (standard deviation [SD] =9.5) years, lower than that of male, which was 34.0 (SD = 4.0) years. The data were analyzed for relevant variables disaggregated by zones and other selected background variables. HIV Sero-prevalence: The National HIV prevalence rate obtained in this survey is 3.4%, lower than 3.6% reported in 2007. HIV prevalence was higher among the wealthier (3.7%) than the poorer (2.9%) among females (3.5%) than males (3.3%) and slightly higher in the rural areas (3.6%) compared with the urban (3.2%). It was highest in the South South zone (5.5%) and lowest in the South East (1.8%). The HIV prevalence was generally higher among respondents with primary and secondary education (4.0%) and lowest among respondents that had Qur'anic education only (2.4%). HIV prevalence was also highest among the 35-39 years age group (4.4%) and lowest among the 15-19 years age group (2.9%), whereas the widowed had the highest prevalence (6.2%). Prevalence of HIV of 3.7% reported among respondents who had sexual intercourse in the last 12 months was higher than the overall prevalence of 3.4%. HIV prevalence was found to be associated with transactional sex with respondents who had exchanged sex for a gift/favor having higher prevalence. Keywords: Human immunodeficiency virus and acquired immunodeficiency syndrome, human immunodeficiency virus testing, Nigeria, seroprevalence, sexual behavior
How to cite this article:
Federal Ministry of Health (Nigeria). National human immunodeficiency virus and acquired immunodeficiency syndrome and Reproductive Health Survey 2012 (plus II): Human immunodeficiency virus Testing. J HIV Hum Reprod 2014;2:15-29 |
How to cite this URL:
Federal Ministry of Health (Nigeria). National human immunodeficiency virus and acquired immunodeficiency syndrome and Reproductive Health Survey 2012 (plus II): Human immunodeficiency virus Testing. J HIV Hum Reprod [serial online] 2014 [cited 2018 Feb 25];2:15-29. Available from: http://www.j-hhr.org/text.asp?2014/2/1/15/135744 |
| Introduction | |  |
Human immunodeficiency virus (HIV) prevalence data provide important information to plan national response, to evaluate program impact, and to measure progress in the national multi-sectoral strategic framework for the control of HIV and acquired immunodeficiency syndrome (AIDS). The understanding of the distribution of HIV infection within the population and analysis of the social, biological and behavioral factors associated with it offer new insights about the HIV epidemic in Nigeria, which should lead to more precisely targeted messages and prioritized interventions.
In Nigeria, estimates of HIV prevalence have been based on sentinel survey of women attending antenatal clinics (ANC). This system, which excludes men, nonpregnant women and even pregnant women who do not attend ANC, does not provide a true representative data for the general population. [1],[2],[3],[4],[5],[6],[7] National HIV and AIDS and Reproductive Health Survey (NARHS Plus) is the first national HIV testing survey of the general population, which was aimed at providing HIV estimates at national, zonal and state levels. It also provides a measure of HIV prevalence for women and men.
| 1. Human Immunodeficiency Virus (HIV) Testing Acceptance | | |
[Table 1] shows that the national HIV testing acceptance among respondents in this survey was 76%. This was higher in the rural areas (77%) than in the urban areas (73%). Overall, acceptance was highest in the South South zone (84%), among respondents with primary education (80%), in the 15-24 years age group (77%) and the separated/divorced (81%).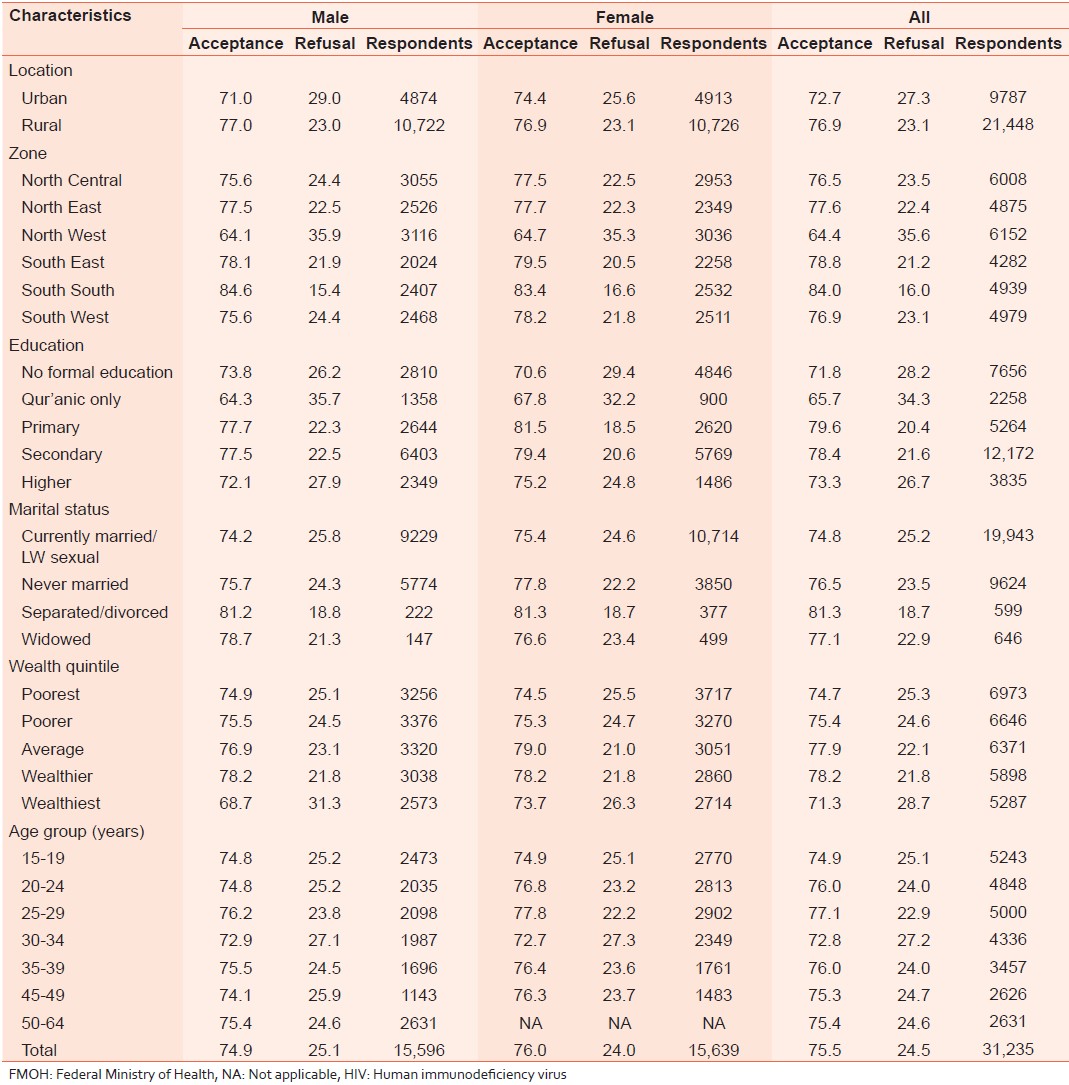 | Table 1: Percentage distribution of HIV testing acceptance among all respondents by selected characteristics; FMOH, Nigeria, 2012
Click here to view |
| 2. Overall HIV prevalence | | |
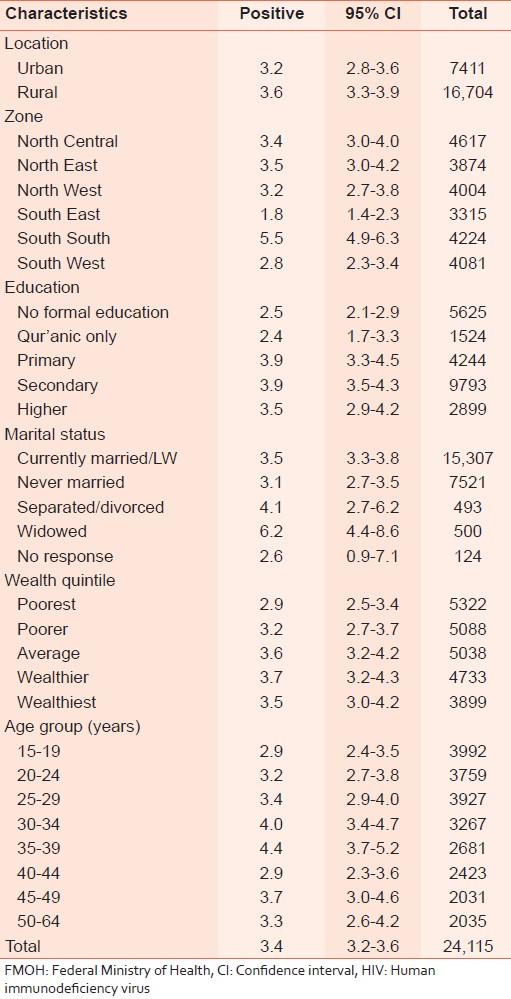
[Table 2] shows the overall HIV prevalence and prevalence by selected characteristics. The national HIV prevalence obtained in this survey was 3% showing a slight decline when compared with NARHS 2007 (3.6%). It was higher among the wealthier (4%) than the poorest (3.0%); slightly higher in the rural area (4%) compared with the urban area (3%). It was highest in the South South zone (6%) and lowest in the South East (2%). Prevalence was generally higher among respondents with primary and secondary education (4% each) and lowest among respondents that had Qur'anic education only (2%). HIV prevalence was highest among the 35-39 years age group (4%) and lowest among the 15-19 years age group (3%) with the widowed having the highest prevalence (6%). The pattern of distribution of HIV prevalence by sex showed that irrespective of sex disaggregation, the HIV prevalence pattern is the same across all selected background characteristics [Table 3]. [Figure 1] shows the distribution of HIV Prevalence by sex and zones, while [Figure 2] shows HIV Prevalence by age group and sex.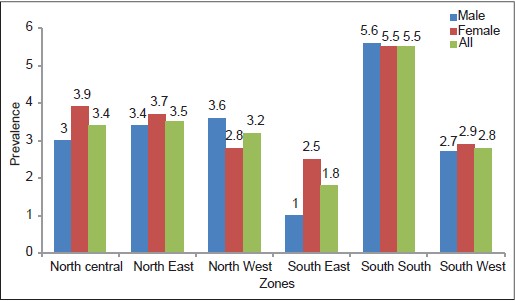 | Figure 1: Human immunodefi ciency virus prevalence by sex and zones: Federal Ministry of Health, Nigeria, 2012
Click here to view |
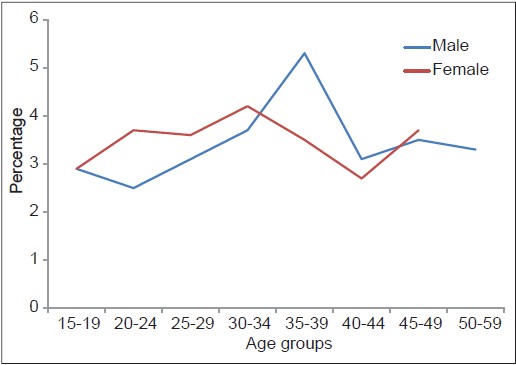 | Figure 2: Human immunodefi ciency virus prevalence by age group and sex; Federal Ministry of Health, Nigeria, 2012
Click here to view |
 | Table 2: HIV prevalence according to selected characteristics; FMOH, Nigeria, 2012
Click here to view |
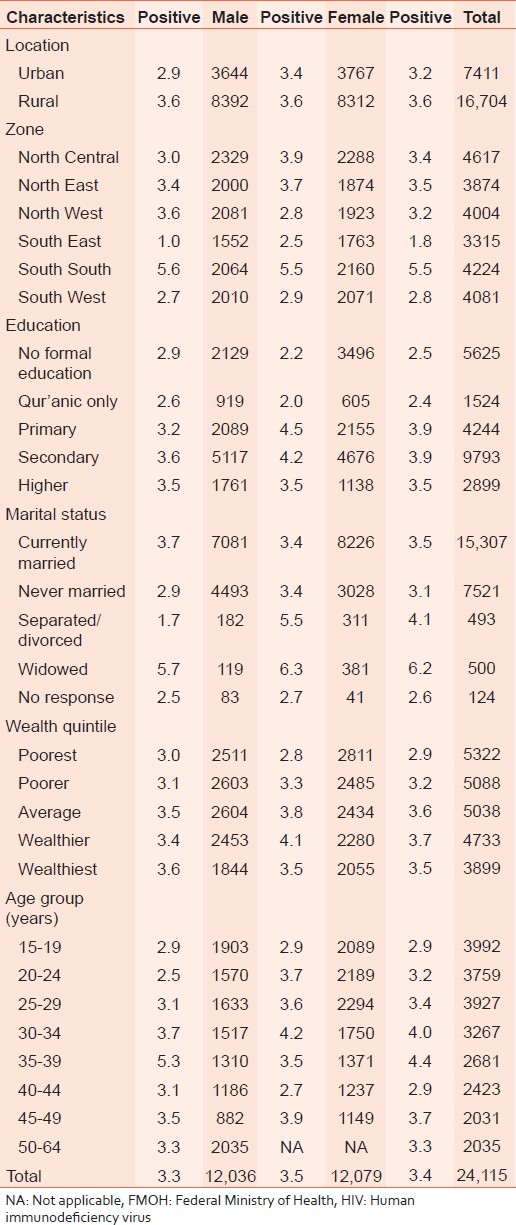 | Table 3: HIV prevalence of all respondents according to selected background characteristics: FMOH, Nigeria, 2012
Click here to view |
| 3. HIV Prevalence by state and sex of Respondents | | |
Overall, the prevalence was 3% with a range of 0.4% (Zamfara State) to 15% (Rivers States). Females had higher prevalence. Twelve states had prevalence above that of Gombe, which has the same prevalence as the national value [Table 4].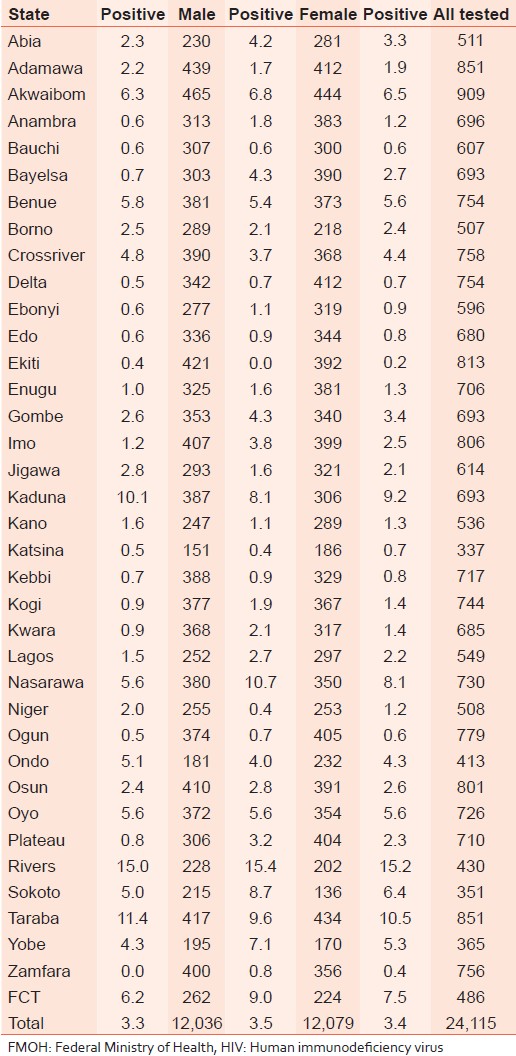 | Table 4: Prevalence of HIV by state and sex of respondents; FMOH, Nigeria, 2012
Click here to view |
| 4. HIV prevalence and use of drinks containing alcohol | | |
Drinking alcohol has been associated with high risk sexual behavior. [Table 5] shows the HIV prevalence among respondents who used alcohol. It shows a prevalence of 5% among respondents who took drinks containing alcohol every-day, 4% among those who took alcohol at least once a week, 4% among those who took alcohol less than once a week and 3% among those who never took alcohol. For those who took drinks containing alcohol every-day, HIV prevalence was higher among females (7%) than their male counterparts (4%). It was highest in the North East zone (11%), among those with no formal education (11%), in the 15-19 year age group (8%), widowed (25%) and among the poorest respondents (7%).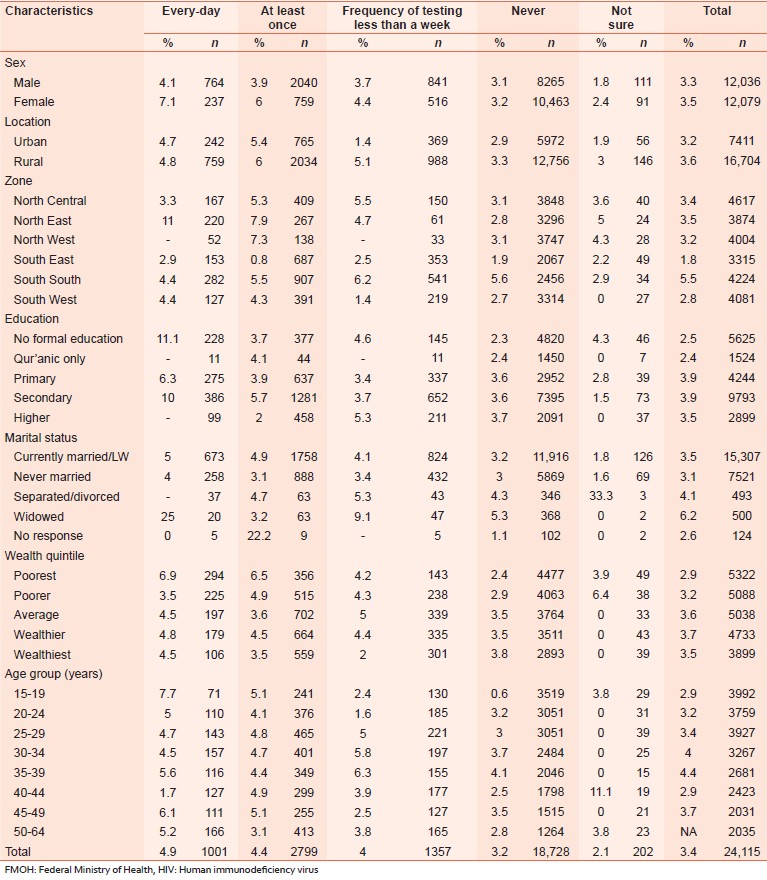 | Table 5: Percentage distribution of HIV prevalence by use of drinks containing alcohol according to selected background characteristics; FMOH, Nigeria, 2012
Click here to view |
| 5. HIV prevalence and Tobacco smoking | | |
[Table 6] shows the HIV prevalence among respondents who smoked tobacco. It shows a prevalence of 4% among respondents who smoked tobacco and 3% among nonsmokers. The prevalence among males who smoked tobacco (4%) was higher than among males who were not smoking tobacco (3%). The prevalence pattern was in the inverse among female respondents with HIV prevalence of 2% recorded among those who smoked and 4% among nonsmokers. Among those who smoked tobacco, HIV prevalence was higher in the South South zone (5%) and lowest in the South West zone (2%). There was no difference in HIV prevalence by location; prevalence in respondents who smoked was 4% in urban and rural areas, respectively. It was highest in the South South zone (5%), among those with higher education (5%), those in 35-99 year age group (6%) and among respondents who were widowed (11%).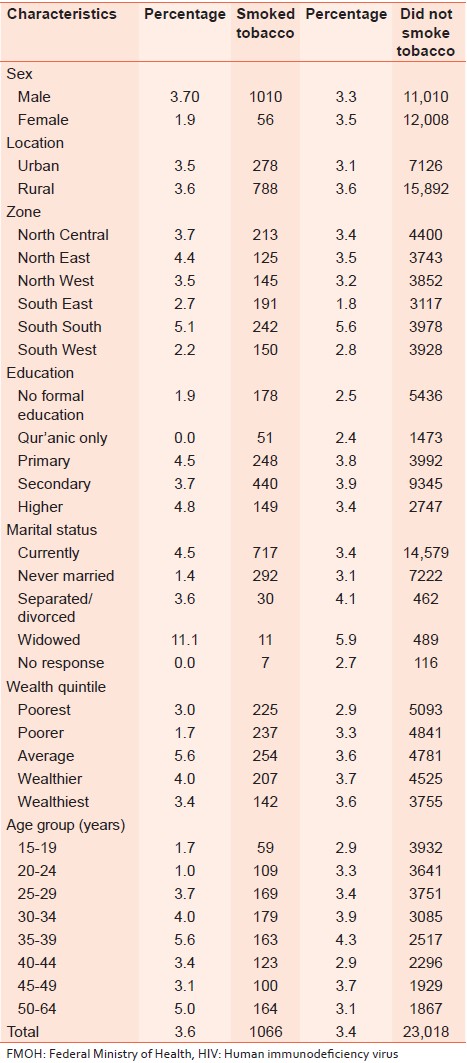 | Table 6: HIV prevalence and tobacco smoking according to selected background characteristics; FMOH, Nigeria, 2012
Click here to view |
| 6. HIV prevalence by use of condoms in non marital sex | | |
[Table 7] shows HIV prevalence among all respondents who reported male condom use in the last sex act with a nonmarital partner. The prevalence was 4% for those who used condom in their last nonmarital sex act, compared to 5% among those who did not use condom. Among respondents who did not use condom in their last nonmarital sex act, prevalence was higher in rural areas (5%), in the South South zone (7%), among the widowed (12%) and in the 45-49 year age group (9%).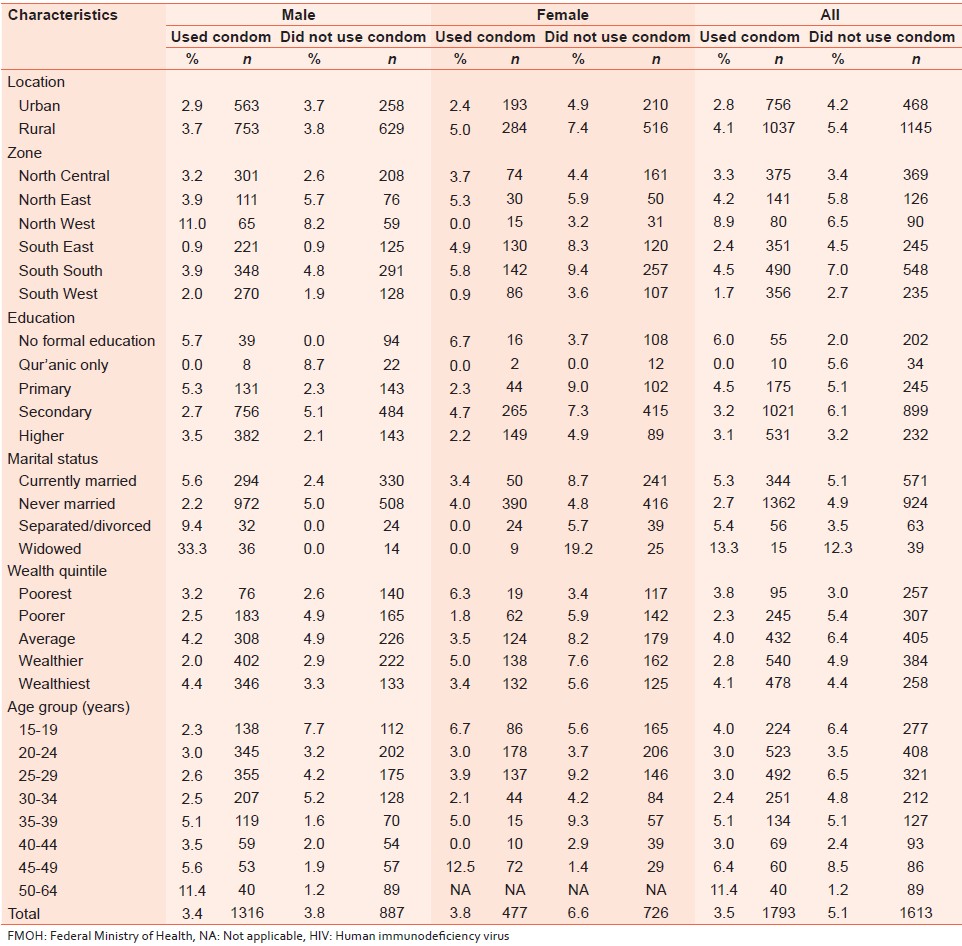 | Table 7: HIV prevalence among all respondents who reported male condom use in the last sex act with a nonmarital partner according to selected characteristics; FMOH, Nigeria, 2012
Click here to view |
| 7. HIV prevalence and sexual activity | | |
[Table 8] shows HIV prevalence by sexual activity of all respondents. HIV prevalence was higher among respondents who had ever had sex (4%) than those who had never had sex (2%). Prevalence was 4% among male respondents who had ever had sex and 2% among male respondents who had never had sex while it was 4% among the ever had sex females and 3% among female respondents who had never had sex. Prevalence was also higher in the South South zone among respondents who had ever had sex (6%) and those who had never had sex (4%) than in other zones. While those who had ever had sex had higher prevalence than those who had never had sex according to educational status this was not so for those who had Qur'anic education (ever had sex was 2% and never had sex was 3%) or higher education (ever had sex was 3% and never had sex was 4%). Age group 30-34 year had the highest HIV prevalence among respondents who had never had sex (8%) and 35-39 year age group had the highest prevalence among respondents who had ever had sex (4%).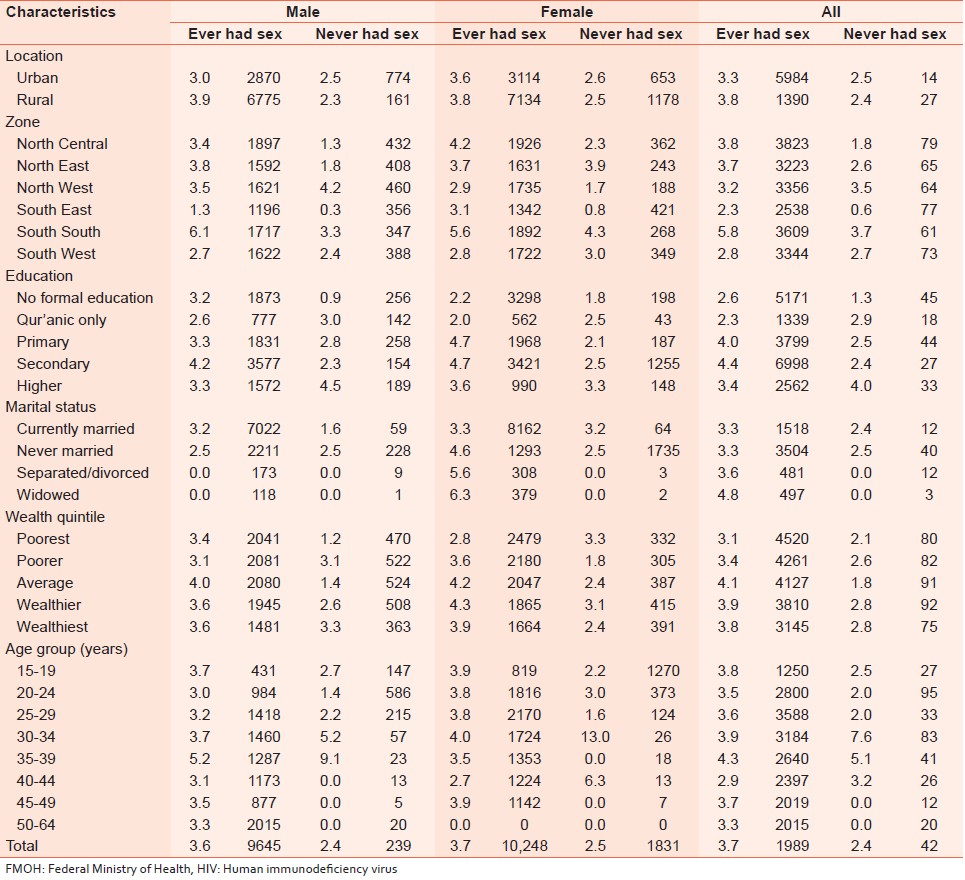 | Table 8: HIV prevalence by sexual activity of all respondents according to selected characteristics; FMOH, Nigeria, 2012
Click here to view |
| 8. HIV virus prevalence and sexual activity in the preceding 12 months | | |
[Table 9] shows HIV prevalence among all respondents who had sexual intercourse in the last 12 months preceding the survey, disaggregated by sex. Prevalence was 4% among respondents who had sexual intercourse in the last 12 months and 3% among respondents who did not have sexual intercourse in the last 12 months. Among respondents who had sexual intercourse in the last 12 months prevalence was 4% among males and 2% among females and among respondents who had no sexual intercourse prevalence was 4% among males and 4% among females. Prevalence was also higher in the South South zone among respondents who had sexual intercourse in the last 12 months (6%) and those that did not have sexual intercourse in the last 12 months (5.0%) than in other zones.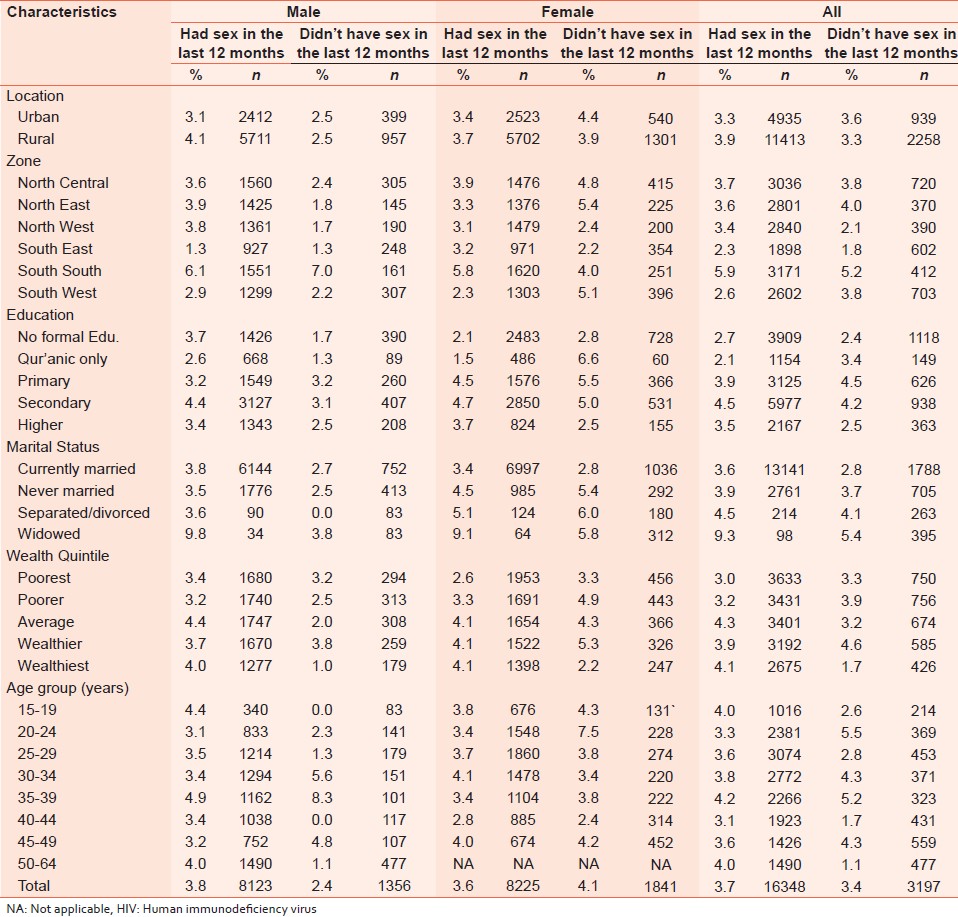 | Table 9: HIV prevalence among all respondents Who had sexual intercourse in the last 12 months preceding survey, disaggregated by sex according to selected characteristics; FMOH, Nigeria, 2012
Click here to view |
| 9. HIV prevalence and knowledge of the Two Prevention Methods of HIV and Acquired Immunodeficiency Syndrome (Unaids Indicators) | | |
Overall, respondents who knew the two UNAIDS prevention indicators had higher prevalence (4%) compared with those who mentioned none or just one, ironically though. The prevalence among those with knowledge of the two indicators was higher in rural areas, in females, highest in the South South zone and among widows (7% for the "know all" and 5% for "the know one" or "none") [Table 10].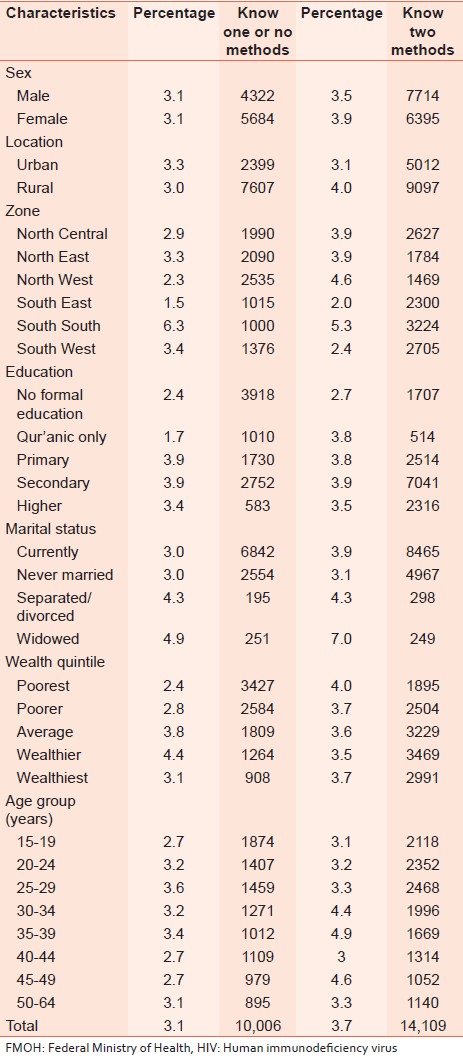 | Table 10: HIV prevalence and knowledge of the two prevention methods according to selected characteristics; FMOH, Nigeria, 2012
Click here to view |
| 10. HIV prevalence and comprehensive knowledge of 5 ways of HIV transmission | | |
Ironically, HIV prevalence was higher among the respondents with comprehensive knowledge of the five modes of transmission than those who knew less. This was also observed with most of the characteristics. The expected correlation between knowledge and HIV prevalence was observed in only the three southern zones, among the 15-19 and 25-29 year age groups and the poorer; while those with secondary education and average wealth had the same prevalence for the two broad groups [Table 11].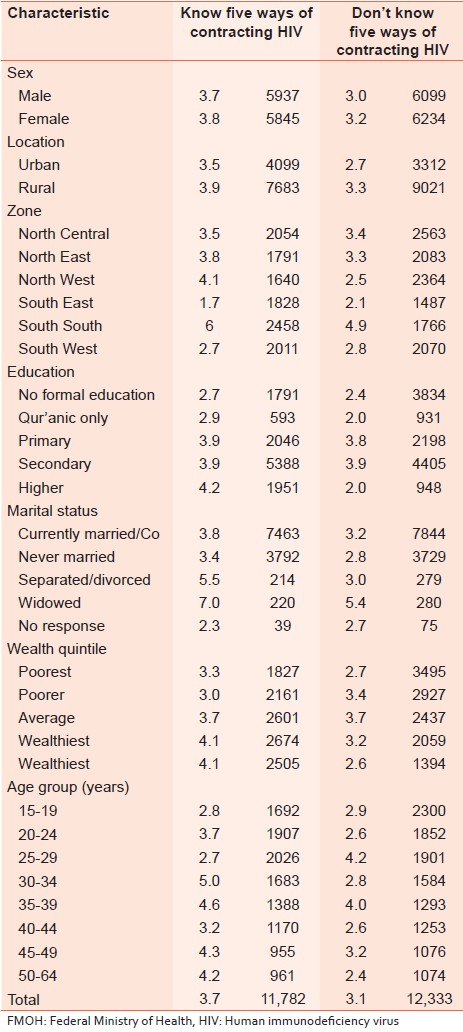 | Table 11: HIV prevalence and comprehensive knowledge of fi ve ways of HIV transmission according to selected characteristics; FMOH, Nigeria, 2012
Click here to view |
| 11. HIV prevalence and ever had sex for gifts | | |
Expectedly, those who engaged in sex in exchange for gifts had higher prevalence, both overall and when disaggregated. This indicates that transactional sex carries higher risk of HIV infection. This risk was higher in rural areas for males and urban for females, in the Northern and South South zones and among the wealthiest for males and poorer for females [Table 12].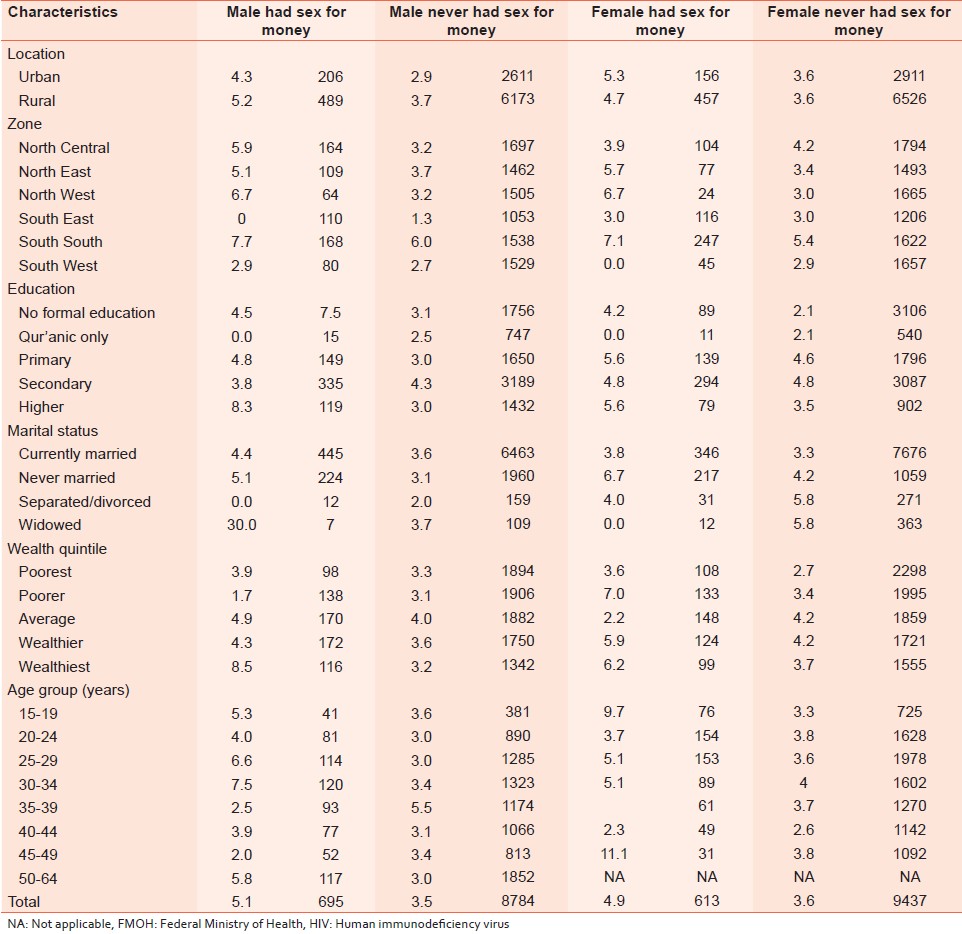 | Table 12: Prevalence of HIV and ever had sex for money or gift according to selected characteristics; FMOH, Nigeria, 2012
Click here to view |
| 12. HIV | | |
Prevalence and Numbers Of Non-Marital Partners [TAG:2][/TAG:2]
[Table 13] shows the prevalence of HIV by current numbers of nonmarital partners. Among the respondents who had no nonmarital partners, HIV prevalence was 3% compared with 5% among those who had one nonmarital partner in the last 1 year. It was also highest among those who had two or more nonmarital partners in the last 12 months (5%) and among the wealthiest (6%).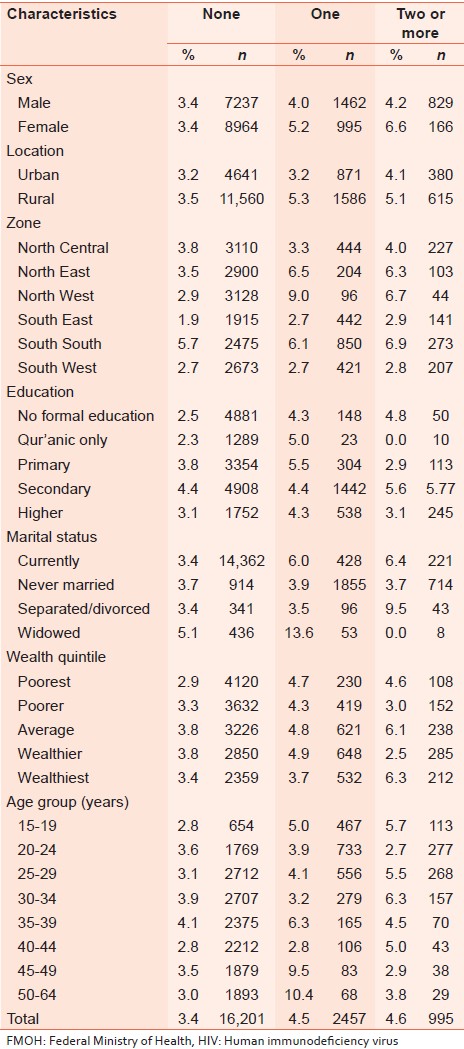 | Table 13: HIV prevalence and number of nonmarital sexual partners according to selected characteristics; FMOH, Nigeria, 2012
Click here to view |
| 13. HIV Prevalence and Number of Sexual Partners | | |
[Table 14] shows HIV prevalence among all respondents who had one or more than one sexual partners. The prevalence of HIV among male and female respondents with one partner was 4% and 4%, respectively compared to those with two or more sexual partners, 4% and 6%, respectively.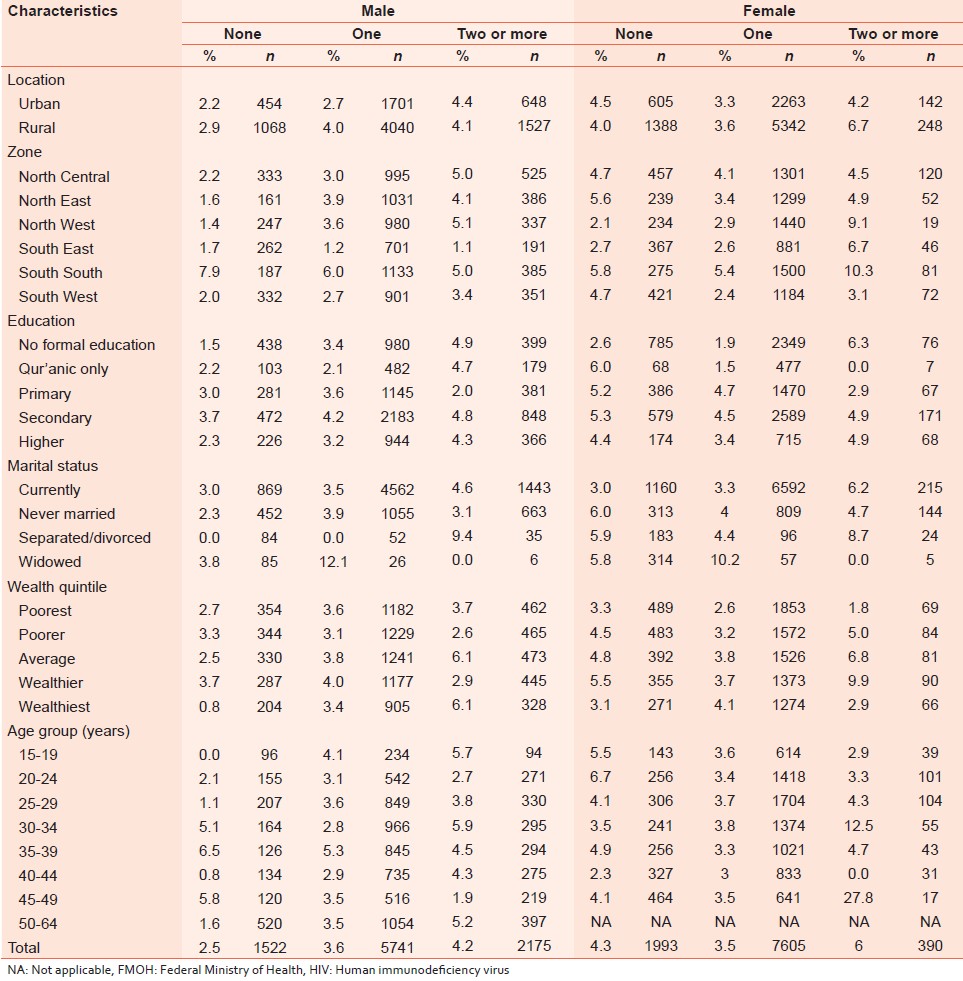 | Table 14: HIV prevalence and number of sexual partners among all respondents according to selected characteristics; FMOH, Nigeria, 2012
Click here to view |
| 14. Perceived Self risk of HIV Infection and HIV Prevalence | | |
Respondents who perceived themselves at high risk for HIV infection had overall prevalence of 5% compared to those with low risk perception (4%). Among those who perceived themselves to be at high risk, higher proportion of urban dwellers was HIV positive compared with the rural dwellers. Furthermore, among those who perceived themselves to have low risk, those in the South South had a higher proportion of those infected with HIV compared with those in the South East zones and widows had a higher proportion compared to those currently married or never married [Table 15].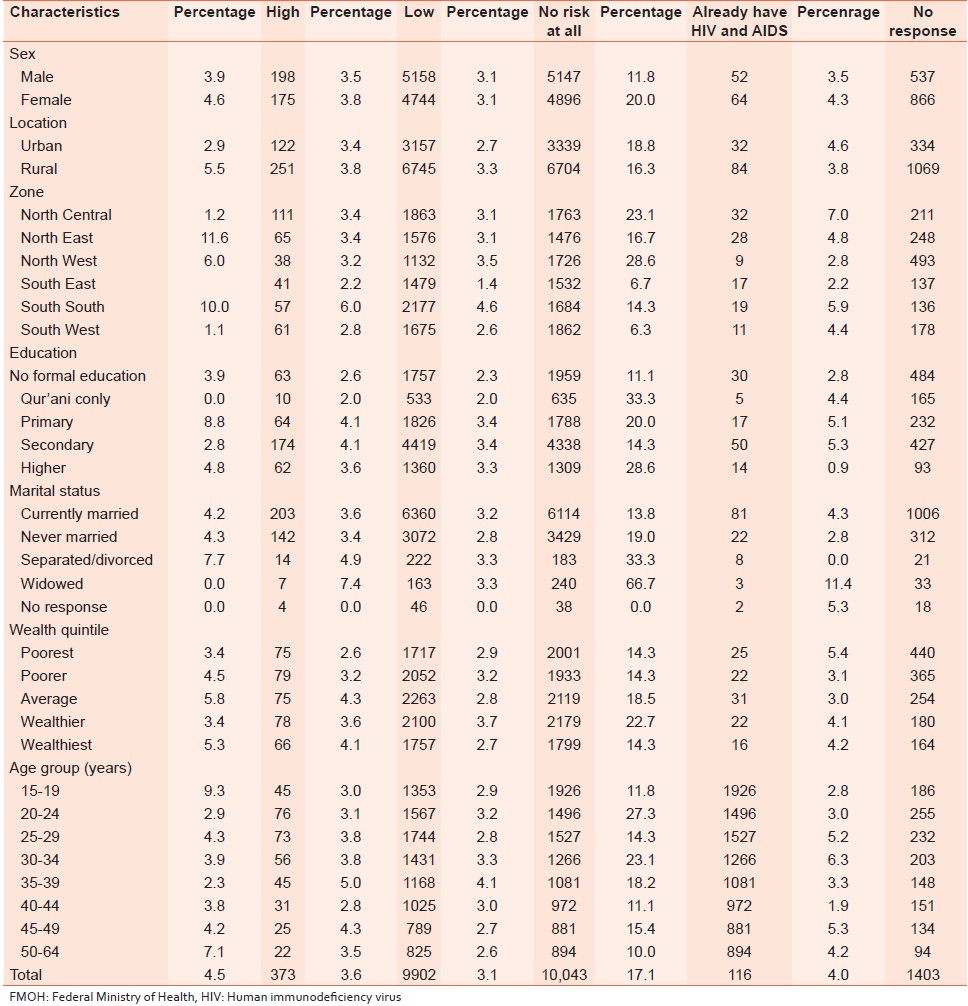 | Table 15: HIV prevalence and perceived self-risk of HIV infection according to selected characteristics; FMOH, Nigeria, 2012
Click here to view |
| Discussion and conclusions | | |
The slight drop in HIV testing acceptance between 2007 and 2012 NARH surveys was not to be totally unexpected, considering the nation-wide expansion of HIV counseling and testing activities in the past 5 years. [8],[9] Nationally, HIV prevalence dropped slightly from 2007 while the hot spot states have shifted from the traditional North Central to South South zones. The factors at play need to be investigated, especially through local studies undertaken by the states affected.
The higher prevalence in the rural areas calls for greater attention, more so with its challenging accessibility and the fact that 60% of the population reside in rural areas. Furthermore, the finding of much higher prevalence among the wealthiest, compared with the poorest, raises cause for concern. It tends to contradict popular belief that HIV and AIDS is a condition more common among the poor. Control efforts therefore need to be targeted towards this group as they could be difficult to access. The prevalence in the states have identified new hot spots and cold spots, showing that the dynamics of the HIV epidemic are ever changing, depending mostly on the consistency and sustainability of the actions being taken. This study suggested a direct relationship between alcohol intake and HIV infection, with prevalence rising from no intake to peak with the daily consumers.
Condom use is expected to reduce the risk of HIV infection. This was the finding in this study, with a difference as high as 1.6% between users and nonusers. Surprisingly, the study found higher HIV prevalence among the never had sex respondents. While sex is a well-known risk factor for HIV, other nonsex related factors may have been responsible for this finding. In addition, recall bias and willful distortion of the truth about exposure to sex by the respondents may have also contributed. The finding of higher HIV prevalence among respondents with better knowledge of prevention and transmission modes indicates that it is not the knowledge that protects from infection; rather, it is the appropriate actions taken based on the correct knowledge acquired. Thus, suggesting that knowledge alone does not translate to reduction of risk of HIV infection. [10]
In Nigeria, exchange of sex for gift or favor is more of the order and it used to be "material gifts from male to female" but this has included gift from "female to male." With the worsening of individual level economy, the practice is getting more popular. The study showed clearly that this practice carries higher risk. Nonmarital partnership is high risk behavior, but multiple of it is even of greater risk, as indicated by this study. Both can be associated with level of wealth, which is needed to provide the materials required to support the practice.
Widows were shown to be at higher risk of HIV infection based on the findings that they had the highest proportion for sex with more than one partner, second lowest/lowest (male/female) for use of condom in the last sex act with boy or girlfriend and lowest/second lowest (male/female) for use of condom with nonmarital partners. Equally, they had the highest prevalence among respondents who perceived self as low risk for HIV infection. Therefore, programs targeting widows in the country should integrate HIV prevention and control strategies as a major component.
| References | | |
| 1. | Federal Ministry of Health [Nigeria]. National HIV/AIDS and Reproductive Health Survey, 2003. Abuja: Federal Ministry of Health; 2003. 
|
| 2. | Federal Ministry of Health. National AIDS and STI Control Programme: National Health Sector Strategic Plan for HIV/AIDS in Nigeria 2005-2009. Abuja: Federal Ministry of Health; 2005.
|
| 3. | Federal Ministry of Health. National HIV/AIDS and Reproductive Health Survey 2005. Abuja, Nigeria: Federal Ministry of Health; 2006.
|
| 4. | Federal Ministry of Health. 2005 National HIV/Syphilis Sero-prevalence Sentinel Survey. Federal Ministry of Health National AIDS/STI Control Programme; 2006.
|
| 5. | Federal Ministry of Health. HIV/STI Integrated Biological and Behavioural Surveillance Survey (IBBSS) 2007. Abuja, Nigeria: Federal Ministry of Health; 2007.
|
| 6. | Federal Ministry of Health. National Policy on the Health and Development of Adolescents and Young People in Nigeria. Abuja, Nigeria: Federal Ministry of Health; 2007.
|
| 7. | Federal Ministry of Health. National HIV and AIDS and Reproductive Health Survey, 2007 (NARHS Plus). Abuja, Nigeria: Federal Ministry of Health; 2008.
|
| 8. | Federal Ministry of Health and World Health Organisation. Plan to Scale-Up Antiretroviral Treatment for HIV or AIDS in Nigeria 2005-2009. Abuja: Federal Ministry of Health, World Health Organisation; 2005.
|
| 9. | National Action Committee on AIDS (NACA). HIV/AIDS National Strategic Framework 2005-2009. Abuja: NACA; 2004.
|
| 10. | Federal Ministry of Health [FMOH]. Nigeria Integrated Biological and Behavioural Surveillance Survey 2010; 2010.
|
[Figure 1], [Figure 2]
[Table 1], [Table 2], [Table 3], [Table 4], [Table 5], [Table 6], [Table 7], [Table 8], [Table 9], [Table 10], [Table 11], [Table 12], [Table 13], [Table 14], [Table 15]
|


 Search Pubmed for